
For retail and trading businesses operating in Dynamics 365 Finance & Operations (D365FO), the standard Inventory aging storage report (InventAgingStorage) delivers a familiar view: on-hand quantities grouped into four aging buckets, sliced by warehouse and inventory dimensions. It is a starting point, but for most organizations, it is no longer sufficient.
The standard report was built for a simpler operational model. It does not expose average aging days at the entity level. It does not reconcile on-hand quantity and inventory value in a way that survives inter-store transfers. And it offers no pathway to automated provisioning based on true vintage. For businesses managing tens of thousands of SKUs across warehouses, stores, dark stores, and 3PL networks, these gaps translate directly into margin erosion.
This article explains why the standard D365FO inventory aging report does not provide the complete picture, and what retail and trading leaders should demand instead: granular aging buckets, entity-level average sitting days, accurate on-hand quantity and value, and provisioning logic that automatically writes down inventory as it ages.
What the Standard D365FO inventory aging report actually shows
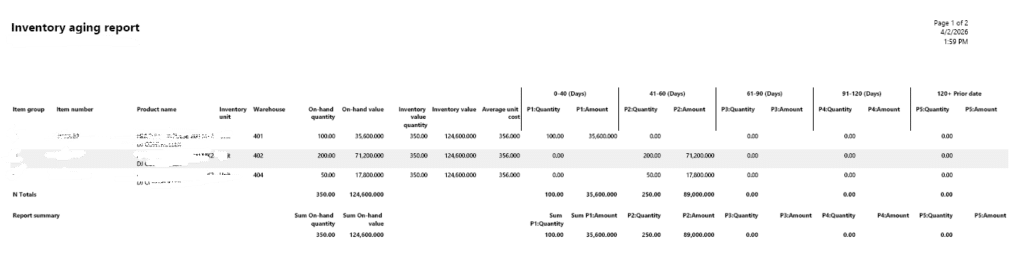
The standard report, accessed via Inventory management > Inquiries and reports > Inventory > Inventory aging report, presents:
- On-hand quantity by aging bucket (typically 0-30, 31-60, 61-90, 90+ days)
- Inventory value per bucket, derived from the item’s active valuation model (FIFO, Weighted Average, or Standard Cost)
- Warehouse-level or inventory-dimension-level granularity
- A vertical column format where each bucket is a separate column
For a single-site manufacturing operation or a small distribution hub, this is adequate. But for retail and trading businesses, the standard report has three structural limitations that make it incomplete:
Fig# Showing output of standard inventory aging report at warehouse level
Limitation 1: Warehouse-level aging, not entity-level aging
The standard report ages inventory at the warehouse or store location where it currently sits. When a transfer order moves stock from Warehouse A to Store B, D365FO records a transfer issue at the source and a transfer receipt at the destination. The standard report treats the transfer-receipt as a new inventory event. The age resets to Day 0 at Store B, even though the stock has been in the entity for 60 days.
For retail networks with frequent inter-store transfers, this means the average aging days shown in the standard report are mathematically disconnected from the business’s true capital exposure. A CFO reviewing the report sees a healthy 34-day average age; in reality, it’s 71 days.
Limitation 2: Four fixed buckets, no granularity
The standard report is constrained to four aging buckets per execution. For a fast-fashion retailer, 0-30 days is far too wide a band. A perishable grocer may need 0-7-day, 8-14-day, and 15-30-day buckets. A trading house importing seasonal goods may need 120-180-day and 180-365-day buckets for long-tail consignment. The standard report cannot accommodate this without multiple executions and manual reconciliation.
Limitation 3: No bridge to provisioning or write-down logic
The standard report shows inventory value per bucket, but it does not connect that value to provision percentages. Finance teams must export the report, map buckets to write-down rules in Excel, manually calculate provision values, and then create inventory write-down journals in D365FO. This introduces latency and reconciliation risk and often results in missed period-end deadlines.
There is no native integration between the aging buckets and the Inventory write-down journal functionality. For a business with thousands of SKUs, this manual bridge is unsustainable.
The incomplete picture: What the standard report hides
To understand why retail and trading businesses outgrow the standard report, consider what it does not expose:
| What Finance & Operations Needs | What Standard Report Shows | What Standard Report Hides | Business Risk |
| True average aging days across all locations | Average age reset by each transfer | True vintage since original receipt | Understated carrying cost; delayed markdowns |
| On-hand quantity reconciled to InventSum | Warehouse-level qty that fragments across transfers | Entity-level qty that matches GL inventory balance | Mistrust between operations and finance |
| Inventory value at original receipt cost | Value re-averaged or re-costed at transfer | Original cost layer preserved through FIFO | Distorted margin analysis and vendor return pricing |
| Automated provision % by category and age | Raw value only; no provision logic | Category-specific write-down rules (e.g., fashion 30% at 60 days) | Manual Excel bridges; missed period-end provisions |
| Granular buckets (0-7, 8-14, 15-30, etc.) | Four fixed buckets | Flexible bucket definitions by business unit | Imprecise markdown timing and transfer rules |
The cumulative effect is that merchandising, supply chain, and finance teams operate from different versions of the truth. The merchandiser sees “fresh” stock at Store B and delays markdowns. The supply chain planner sees low warehouse aging and reorders. The CFO sees a 34-day average age and budgets carrying costs accordingly. None of them is wrong; they are simply looking at a report that was not designed for their operational reality.
What retail and trading businesses actually need from aging analytics
When retail and trading leaders evaluate inventory aging, they are not asking “How old is this stock at Warehouse 12?” They are asking five interconnected questions that the standard report cannot answer in a single view:
Question 1: What is the true average aging days, at the legal entity level?
Average aging days should be calculated from the original physical receipt date (DatePhysical) into the first owned location within the legal entity, excluding all subsequent transfer orders and transfer journals. This metric must be weight-averaged by quantity and available at the item, category, brand, and entity levels.
In D365FO terms, this requires querying InventTrans where the transaction type is a genuine receipt (purchase order receipt, production receipt, or positive inventory adjustment) and excluding transfer-issue and transfer-receipt pairs. The age is calculated as the difference between the user-specified “As of Date” and the original DatePhysical of that first receipt.
Question 2: What is the true on-hand quantity, and where is it now?
On-hand quantity in a custom aging report must reconcile precisely to InventSum or the standard on-hand inventory inquiry. The nuance is that the custom report must show the remaining unsettled quantity per receipt layer.
This ensures that only inventory that is physically and financially still present contributes to the aging pool. The report must then attribute that remaining quantity to its current inventory dimension (location, warehouse, inventory status, configuration, size, color) so that operations know where the aged stock sits today, even though its age is calculated from its original entry into the entity.
Question 3: What is the true inventory value, preserved at original cost?
Inventory value in the standard report is often distorted by transfer-date averaging. A custom report must preserve the original cost amount of each receipt layer. In D365FO, this means prioritizing the financial cost:
Cost = Financial Cost Amount + Adjustment
If the transaction has not yet been updated in the financial system (i.e., only physically posted), the system falls back to the physical cost amount. This dual logic ensures that the aging valuation aligns with both open inventory periods and closed periods post-inventory close. The result is an inventory value per aging bucket that finance can trust for provision calculations and GL reconciliation.
Question 4: Can we define granular, flexible aging buckets by category?
Retail and trading businesses need dynamic bucket definitions managed via a parameter table, rather than hard-coded in report logic. For example:
- Fast Fashion: 0-7, 8-14, 15-30, 31-60, 61-90, 90+ days
- Core Replenishment Basics: 0-30, 31-60, 61-90, 91-180, 180+ days
- Seasonal Trading Imports: 0-60, 61-120, 121-180, 181-365, 365+ days
- Perishables: 0-3, 4-7, 8-14, 15-30 days (tied to batch expiry)
Each bucket range should be assignable to an item group, product category, or season code in D365FO. This allows merchandising and finance to apply different aging sensitivities to different product types within the same report execution.
Question 5: Can provisioning happen automatically based on true age?
This is the capstone requirement. The custom aging engine must connect each bucket to a provision percentage defined in a rules table, and calculate the provision value automatically:
Provision Value = Remaining Value × Provision %
For example, a seasonal fashion category might carry 0% provision at 0-30 days, 15% at 31-60 days, 35% at 61-90 days, and 70% at 90+ days. Core basics might carry 0% at 0-90 days and 25% at 90+ days. At period-end, the system should generate Inventory write-down journal proposals with full audit trail references back to the aging report execution.
The D365FO functional gaps that create this problem
Understanding why the standard report behaves this way requires a brief look at D365FO’s underlying architecture. The gaps are not bugs; they are design choices that made sense for the original use case but do not scale to the complexity of modern retail and trading.
InventTrans: Transfer orders are treated as receipts
The standard aging report queries InventTrans and uses the most recent transaction date to determine age. A transfer order creates two InventTrans records: a transfer-issue (negative) at the source and a transfer-receipt (positive) at the destination. The report treats the positive transfer receipt as a new receipt layer. It has no native logic to trace back to the original purchase order receipt that preceded the transfer.
A custom engine must explicitly exclude TransferOrderIssue and TransferOrderReceipt transaction types from the receipt pool, and instead anchor age to the original purchase order or production receipt.
InventDim: Granularity without aggregation
D365FO stores inventory dimensions (site, warehouse, location, inventory status, batch, serial, configuration, size, color) in the InventDim table. The standard report can slice by these dimensions, but only at the transaction level. For a retailer with size, color, and style variants, the standard report produces fragmented views that are difficult to roll up. A custom report must pre-aggregate by dimension combination and present a clean, pivot-friendly horizontal format.
Inventory valuation models: Cost layer complexity
D365FO supports FIFO, LIFO, Weighted Average, and Standard Cost valuation through Item model groups. The standard aging report displays the current averaged cost, which may not reflect the original receipt cost for items that have been transferred multiple times. A custom aging engine must preserve the original CostAmountPosted per receipt layer and apply FIFO deduction logic to ensure the remaining value is attached to the correct vintage.
No native provisioning rules table
D365FO has robust inventory journal functionality, including inventory write-down, counting, and movement journals, but there is no out-of-the-box aging-to-provision mapping table. Finance teams cannot define “if 61-90 days and Category = Fashion, then provision 35%.” This gap forces every provision calculation into Excel, disconnected from the live inventory data.
The custom solution framework: What your D365FO team should build
The following framework translates the business requirements above into D365FO functional specifications. It is not code; it is the blueprint your functional consultant or technical architect needs to scope the build.
Component 1: Custom FIFO provisioning rules table
A new D365FO parameter table with the following fields:
- Bucket Start Day, Bucket End Day (e.g., 0 to 30, 31 to 60)
- Provision Percentage (e.g., 0%, 15%, 35%)
- Product Category or Item Group filter
- Lifecycle state or Season code filter (optional)
This table is maintained by finance and merchandising users through a custom form. It requires no code changes to add new buckets or adjust provision percentages.
Component 2: Receipt aggregation query (InventTrans)
An X++ query that:
- Reads all InventTrans records up to the user-specified “As of Date”
- Filters for genuine receipts: PurchaseOrder, ProductionOrder, InventoryAdjustment (positive), ReturnOrder
- Excludes TransferOrder, TransferJournal, WHSWork, and WeightedAverageInventoryClosing transactions
- Calculates Remaining Qty = Qty – QtySettled
- Calculates Cost = (Financial Cost + Adjustment) if present, else Physical Cost
- Anchors the receipt date to the original DatePhysical of the first qualifying receipt
Component 3: FIFO issuance deduction engine
The engine aggregates all qualifying issuances (sales orders, production consumption, scrapping, negative adjustments) and deducts them from the oldest receipt buckets first. This produces a residual receipt profile: a set of receipt layers with original posting dates, remaining quantities, and original costs, representing what is truly still on-hand.
Component 4: Dynamic bucket assignment & provision calculation
Each residual receipt layer is aged against the “As of Date.” The engine looks up the matching bucket in the Provisioning Rules table (based on age and category), assigns the bucket label, and calculates:
- Aging Bucket (e.g., “31-60 Days”)
- Remaining On-Hand Qty
- Remaining Value (Original Cost × Remaining Qty)
- Provision % (from rules table)
- Provision Value (Remaining Value × Provision %)
- Average Age Days (weighted average at Item + Entity + Dimension level)
Component 5: Horizontal, line-level output
Unlike the standard vertical column format, the custom report outputs one row per dimensional intersection:
| Field | Description |
| Original Posting Date | Date Physical of the original receipt into the entity |
| Item Number / Product Name | D365FO product identifier |
| Inventory Dimensions | Site, Warehouse, Location, Inventory Status, Config, Size, Color, Batch |
| Current On-Hand Qty | Remaining quantity after FIFO deduction |
| Current On-Hand Value | Remaining value at original receipt cost |
| Aging Bucket | Dynamically assigned from the rules table |
| Age in Days | Days between original DatePhysical and As-of-Date |
| Average Age Days | Weighted average for the item + dimension combination |
| Provision % | From the matched rule |
| Provision Value | Calculated write-down amount |
This format is pivot-ready for Excel, directly ingestible by Power BI, and reconcilable to standard D365FO inventory balances.
Reconciliation: Why finance will trust these numbers
The greatest risk of any custom inventory report is the reconciliation gap. If the custom aging total does not match the standard inventory balance, finance will reject it. The framework above solves this through two invariant checks:
- Total quantity: The sum of all remaining quantities across all buckets and all layers must equal the total on-hand quantity shown in InventSum (or the standard On-hand inventory inquiry) for the same As-of-Date and dimension filters.
- Total value: The sum of all remaining values (original cost × residual quantity) across all buckets must equal the total inventory value shown in the standard Inventory value report or Inventory balance list for the same period.
Because the custom engine excludes only internal transfers and weighted-average closing entries, both of which are net-zero at the entity level, the total on-hand and total value at the entity level remain identical to standard reports. The difference lies entirely in how the total is distributed across time buckets and how provision values are derived. This is the reconciliation narrative for finance: “We have not changed how much inventory you own or what it is worth. We have only revealed how old it truly is, and what it is worth after provision.”
From data to action: What accurate aging enables
With granular aging, average sitting days, accurate on-hand quantity and value, and automated provisioning, the following business actions become systematic rather than reactive:
- Vendor Returns (RTV): Automated alerts at 75% of the vendor return window, with exact quantities and original costs by vendor. RTV journal proposals generated before the option expires.
- Markdown & Discount Cadence: Category-specific discount curves triggered by true age: micro-promotions at Day 21-30, targeted markdowns at Day 31-60, outlet clearance at Day 61-90, liquidation at Day 90+.
- Intelligent Inventory Movement: Transfer rules based on true age and destination velocity: block transfers of 45+ day stock to low-velocity stores; accelerate transfers of <30 day stock to high-velocity locations.
- Carrying Cost Forecasting: True average age drives accurate 15-25% annual carrying cost budgets. A $50M inventory business with 68-day true average age (vs. 42-day standard) budgets $1.42M instead of $875K.
- Period-End Provision Automation: Inventory write-down journals auto-generated from the aging report, mapped to correct GL accounts, with full audit trail and aging report reference.
- Vendor & Buyer Scorecards: Average true age by vendor and buyer, exposing which MOQs and purchasing patterns create capital traps.
Conclusion: Precision in aging is precision in capital
The standard D365FO Inventory aging storage report was built for a simpler era. It gives you four buckets, warehouse-level age, and raw value, enough for a small distributor, insufficient for a modern retail or trading enterprise. It does not give you average aging days at the entity level. It does not give you on-hand quantity and inventory value that survives inter-store transfers. And it certainly does not give you automated provisioning based on true vintage.
For retail and trading businesses, these are not nice-to-have enhancements. They are the difference between recovering margin through vendor returns and surrendering it through emergency liquidation. They are the difference between surgical markdowns and panic discounting. They are the difference between accurate working capital forecasts and a half-million-dollar understatement.
When your D365FO aging analytics reflect true sitting days, anchored to the original receipt, immune to the transfer-date illusion, granular by category, and connected to provision logic, your supply chain decisions sharpen at every level. You move the right stock to the right location at the right time. You exit slow categories before carrying costs compound. You automate write-downs rather than reconstruct them in Excel. And you protect the working capital velocity that defines competitive advantage in retail and trading.
Your inventory aging report should not merely track inventory. It should tell you, with precision, how long it has truly been sitting, how much it is worth today, and exactly how many days you have left to act.