
In today’s data-driven world, organizations need more than standard reporting — they need actionable insights. Business Performance Analytics (BPA) report in Dynamics 365 Finance and Operations enables companies to monitor financial and operational KPIs in real-time. But sometimes, the out-of-the-box reports don’t fully meet business needs.
By extending BPA, you can integrate additional data sources, customize reports, and create more relevant analytics. For example, adding filters such as Vendor Group or creating custom tables linked to Dynamics 365 Finance can help finance teams analyze transactions more effectively.
Why does extensibility matter in BPA?
Standard BPA reports are powerful but generic. Customization allows you to:
- Include additional dimensions like Vendor Group or Legal Entity.
- Enable filters and slicers for targeted analysis.
- Combine BPA with data from Dataverse and Microsoft Fabric for deeper insights.
- Build key performance indicators (KPIs) that match your organization’s priorities.
This ensures that Dynamics 365 business performance analytics adapts to your operations, rather than forcing you to adapt to the system.
Read more: Reimagine financial model with Dynamics 365 Finance and Operations for growth and value
Extensibility scenario: Vendor transactions by group
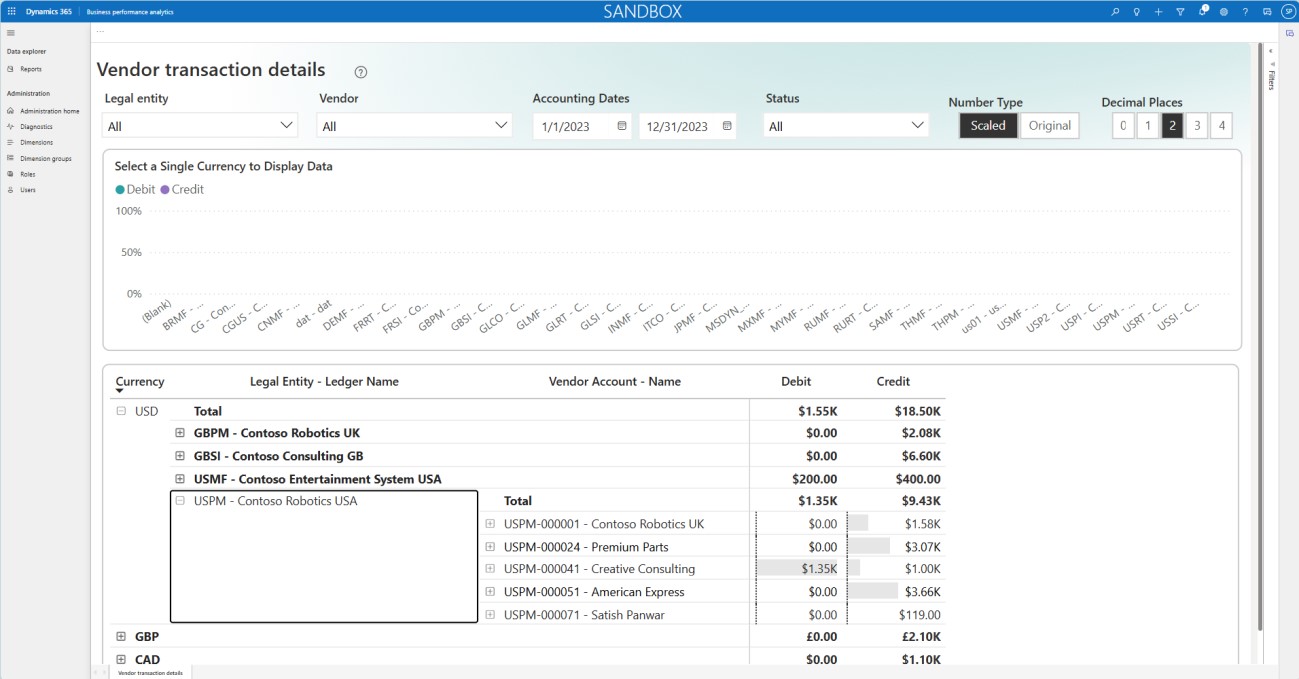
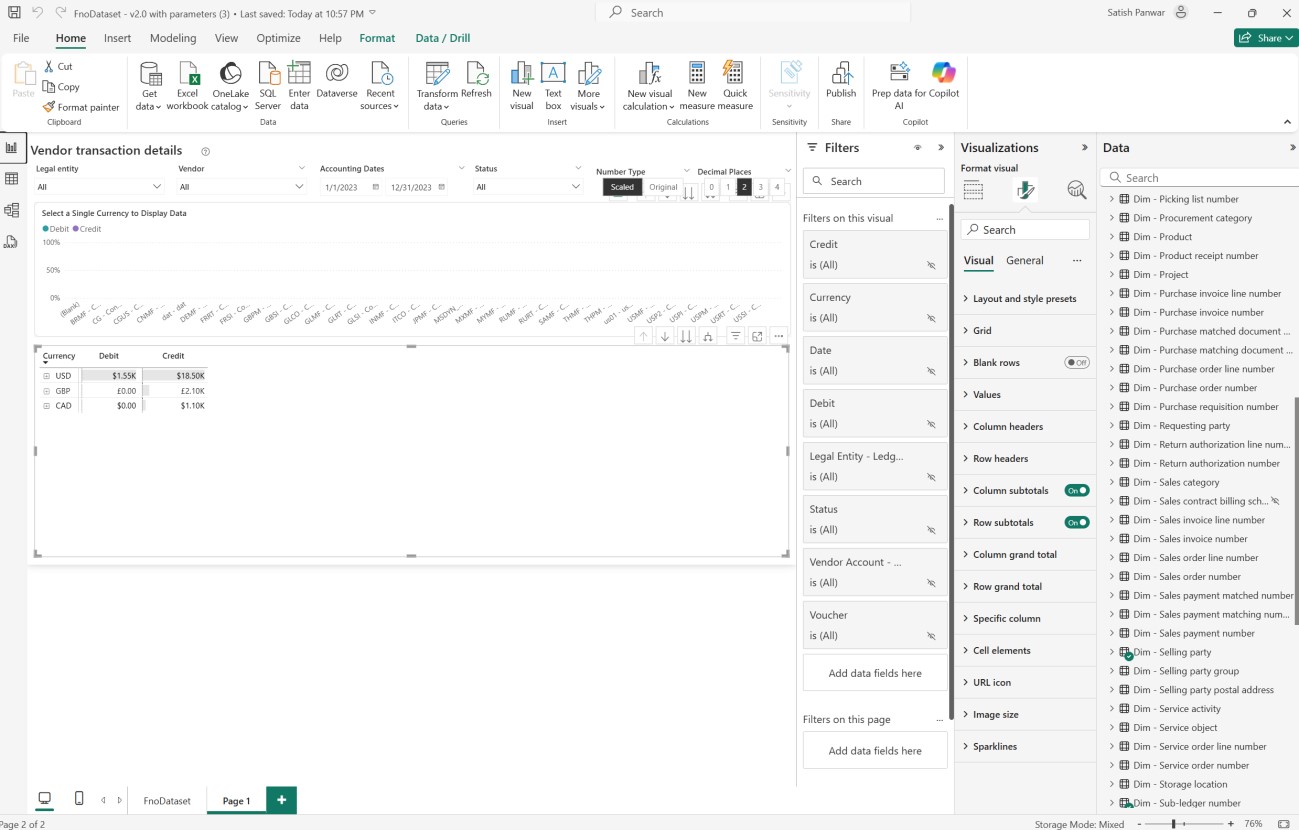
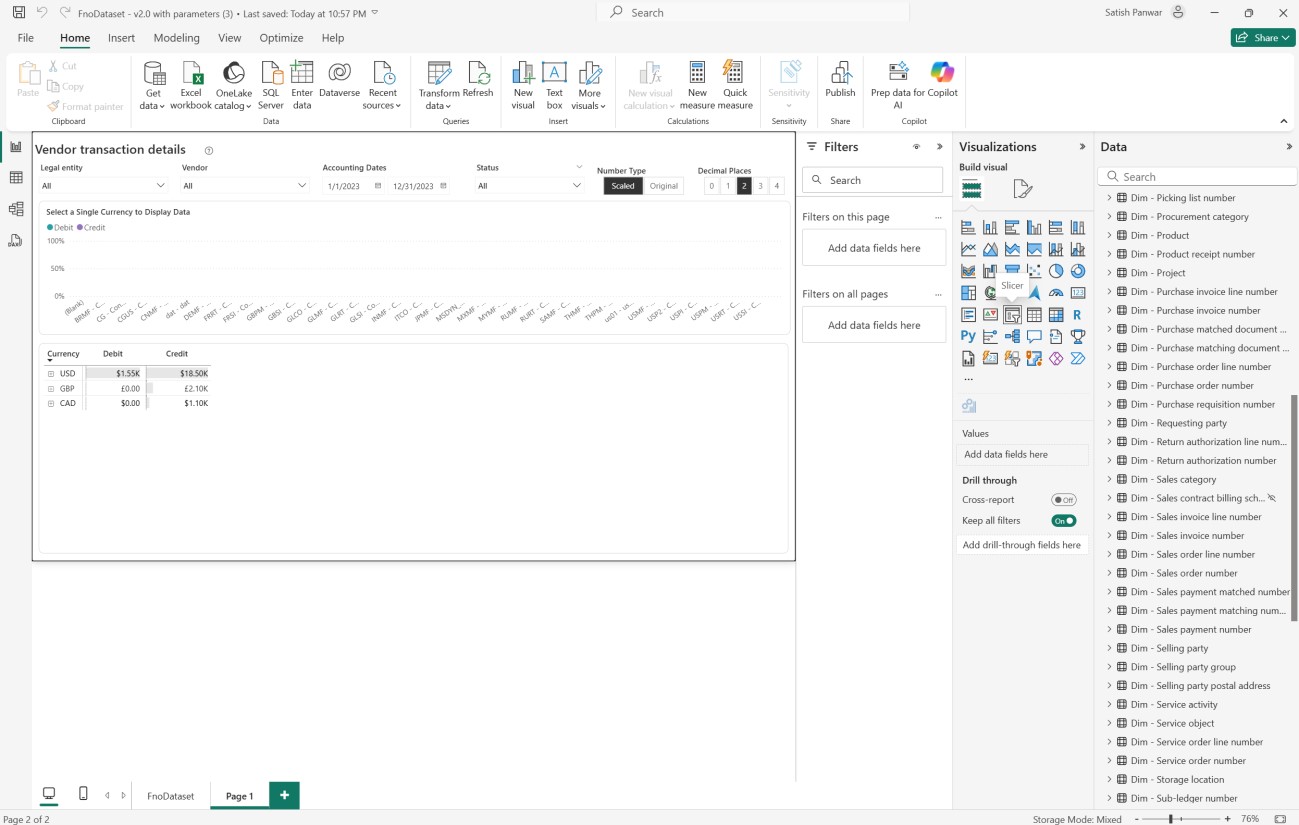
Let’s take the example of the Vendor transaction details report in BPA. By default, it shows transactions by vendor but doesn’t allow filtering by Vendor Group.
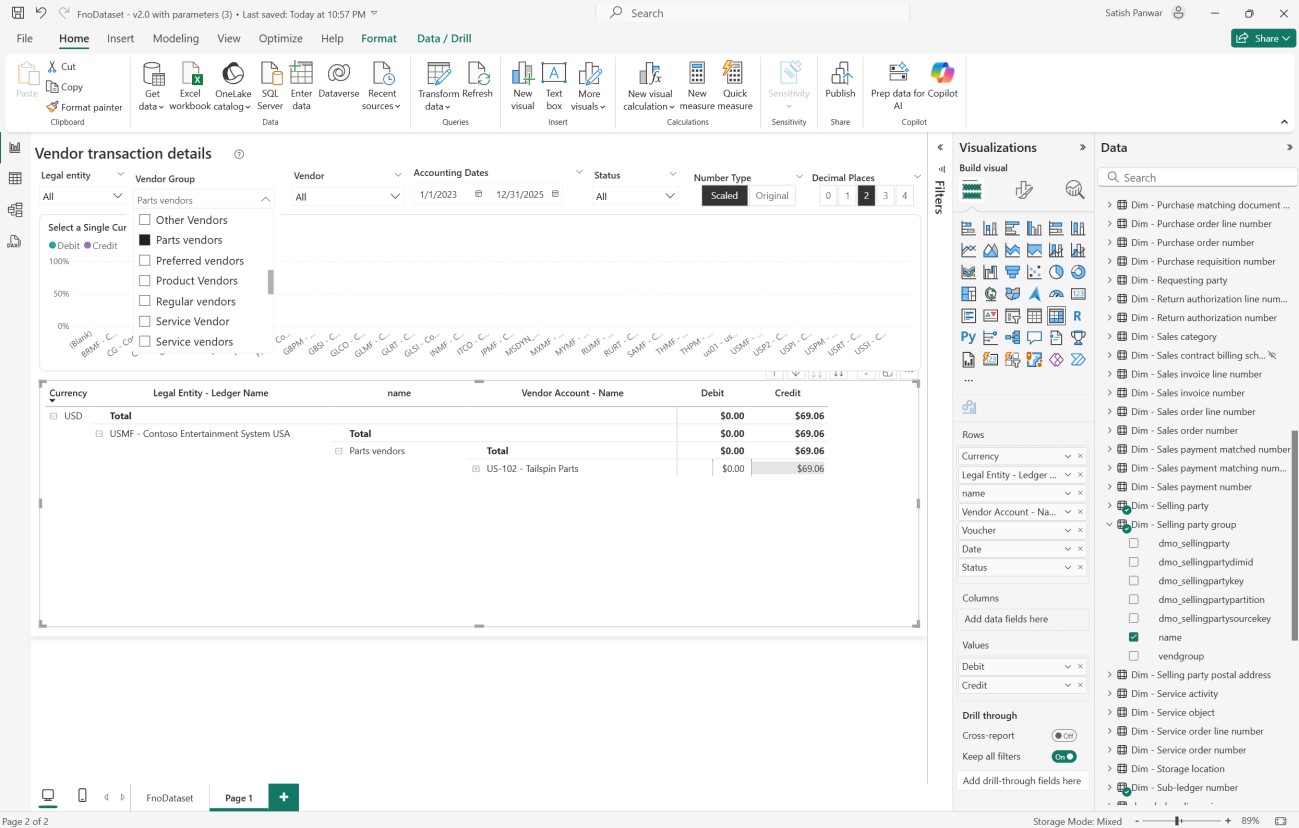
Out of the box, the current “Vendor transaction details report” appears as follows.
By extending BPA, you can:
- Add a slicer to filter vendor transactions by group.
- View transactions grouped by Legal Entity and Vendor Group.
- Gain more precise insights into accounts payable and supplier management.
Pre-requisites to get started with BPA
Before you begin, ensure you have:
- A Power BI Premium or Fabric capacity license.
- Dynamics 365 Finance and Operations linked to the Power Platform (Dataverse).
- Business Performance Analytics installed.
Step-by-step guide: How to extend BPA reports
To extend Business Performance Analytics (BPA) reports in Dynamics 365, you need to connect BPA with Microsoft Fabric, Dataverse, and relevant Finance tables. The process involves creating a workspace, linking data sources, and updating reports in Power BI. The steps outlined below provide a clear and structured approach.
Step 1: Create a Fabric workspace
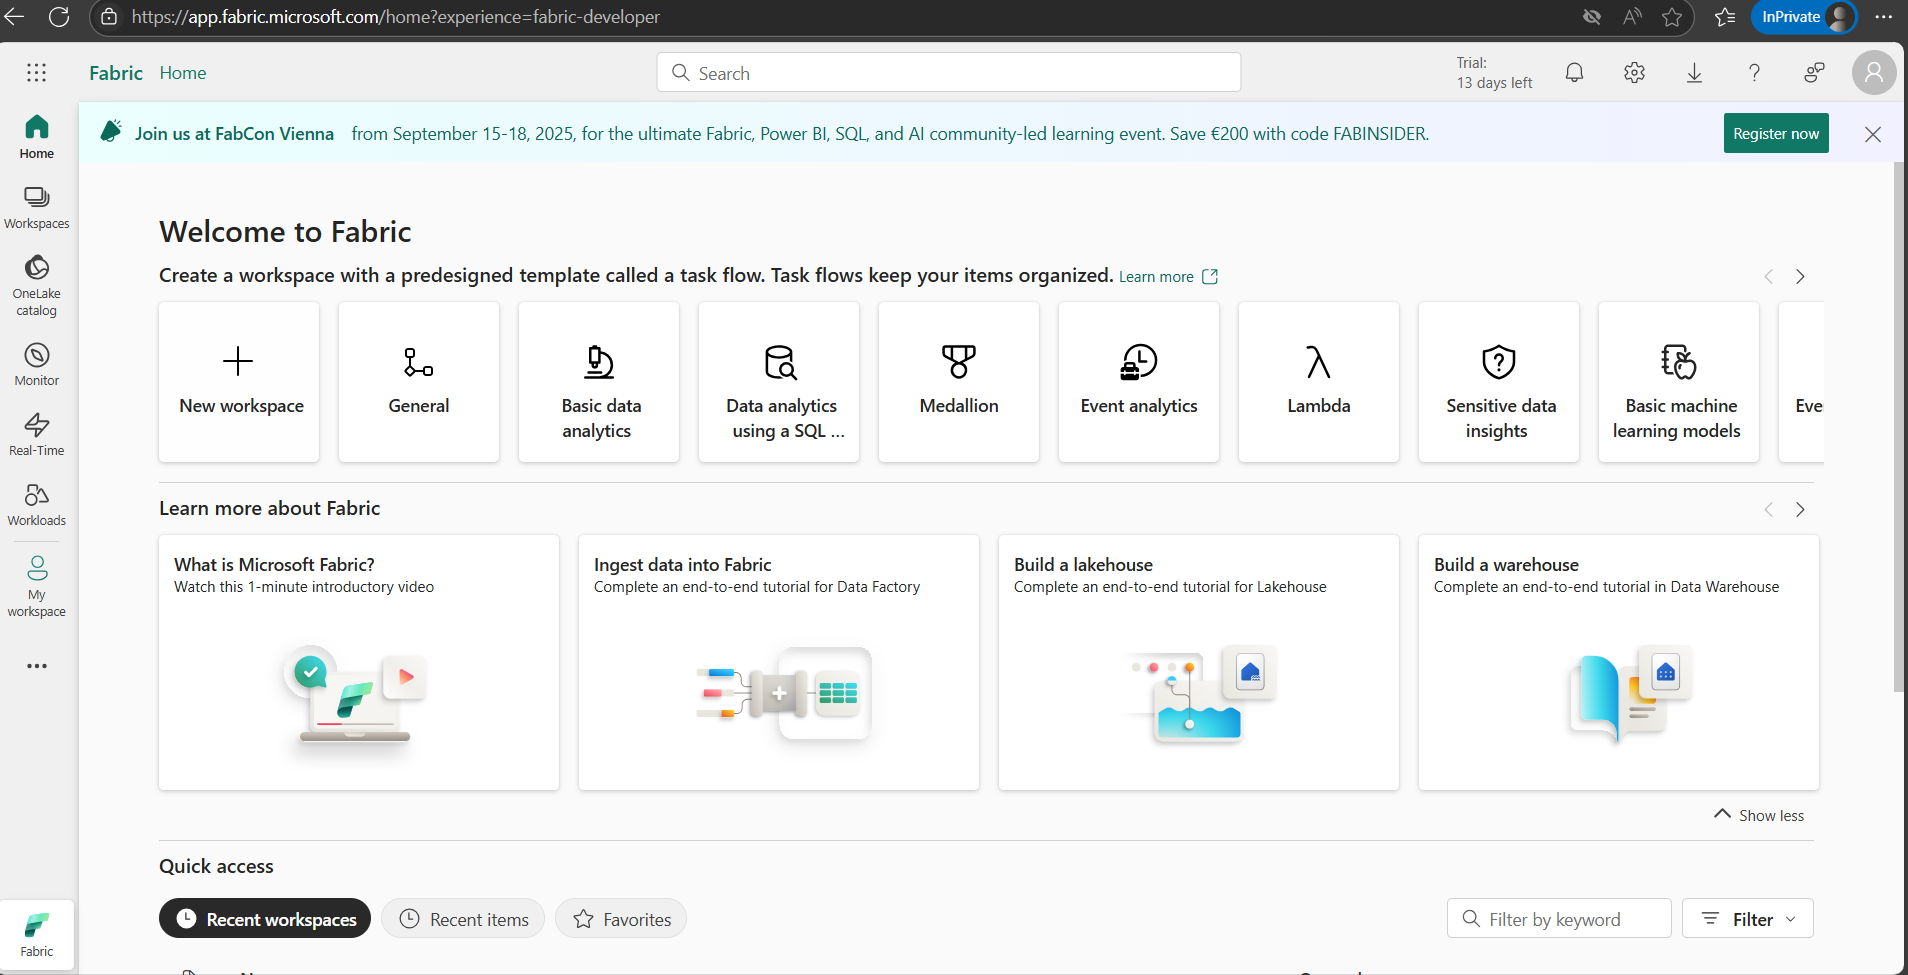
1- Log in to Fabric.
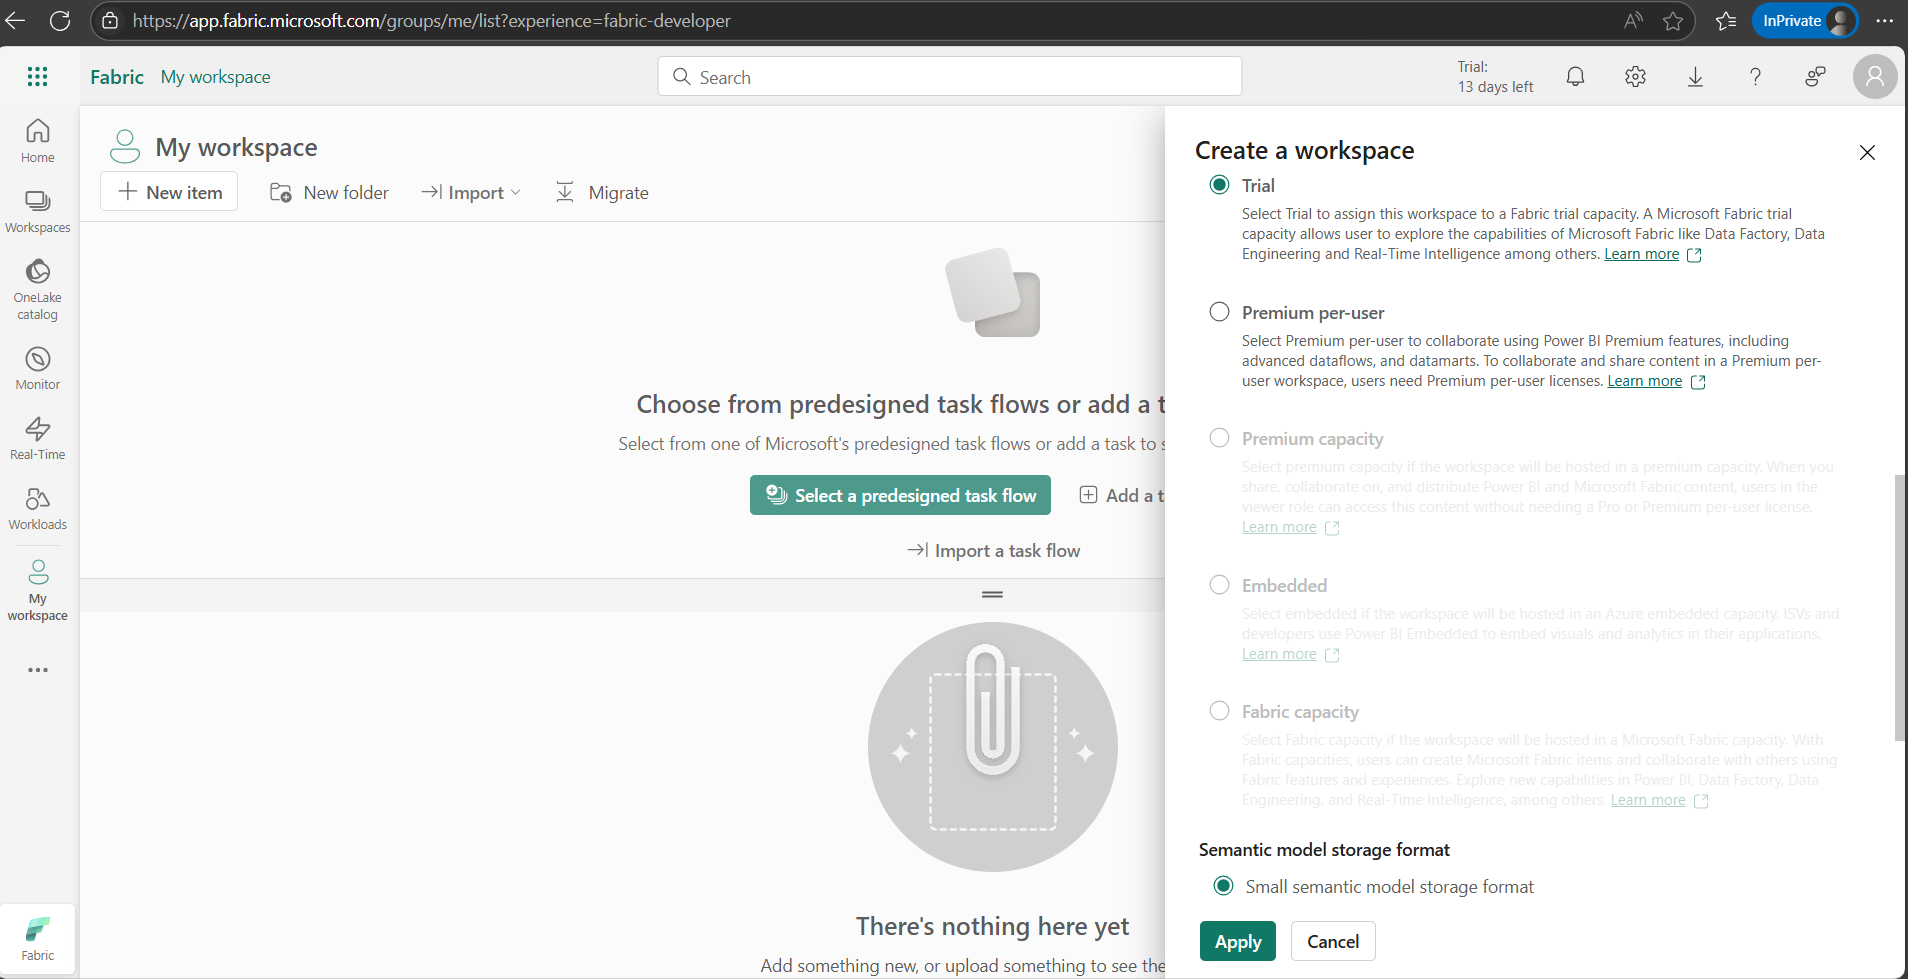
2- Create a new workspace by clicking on + sign.
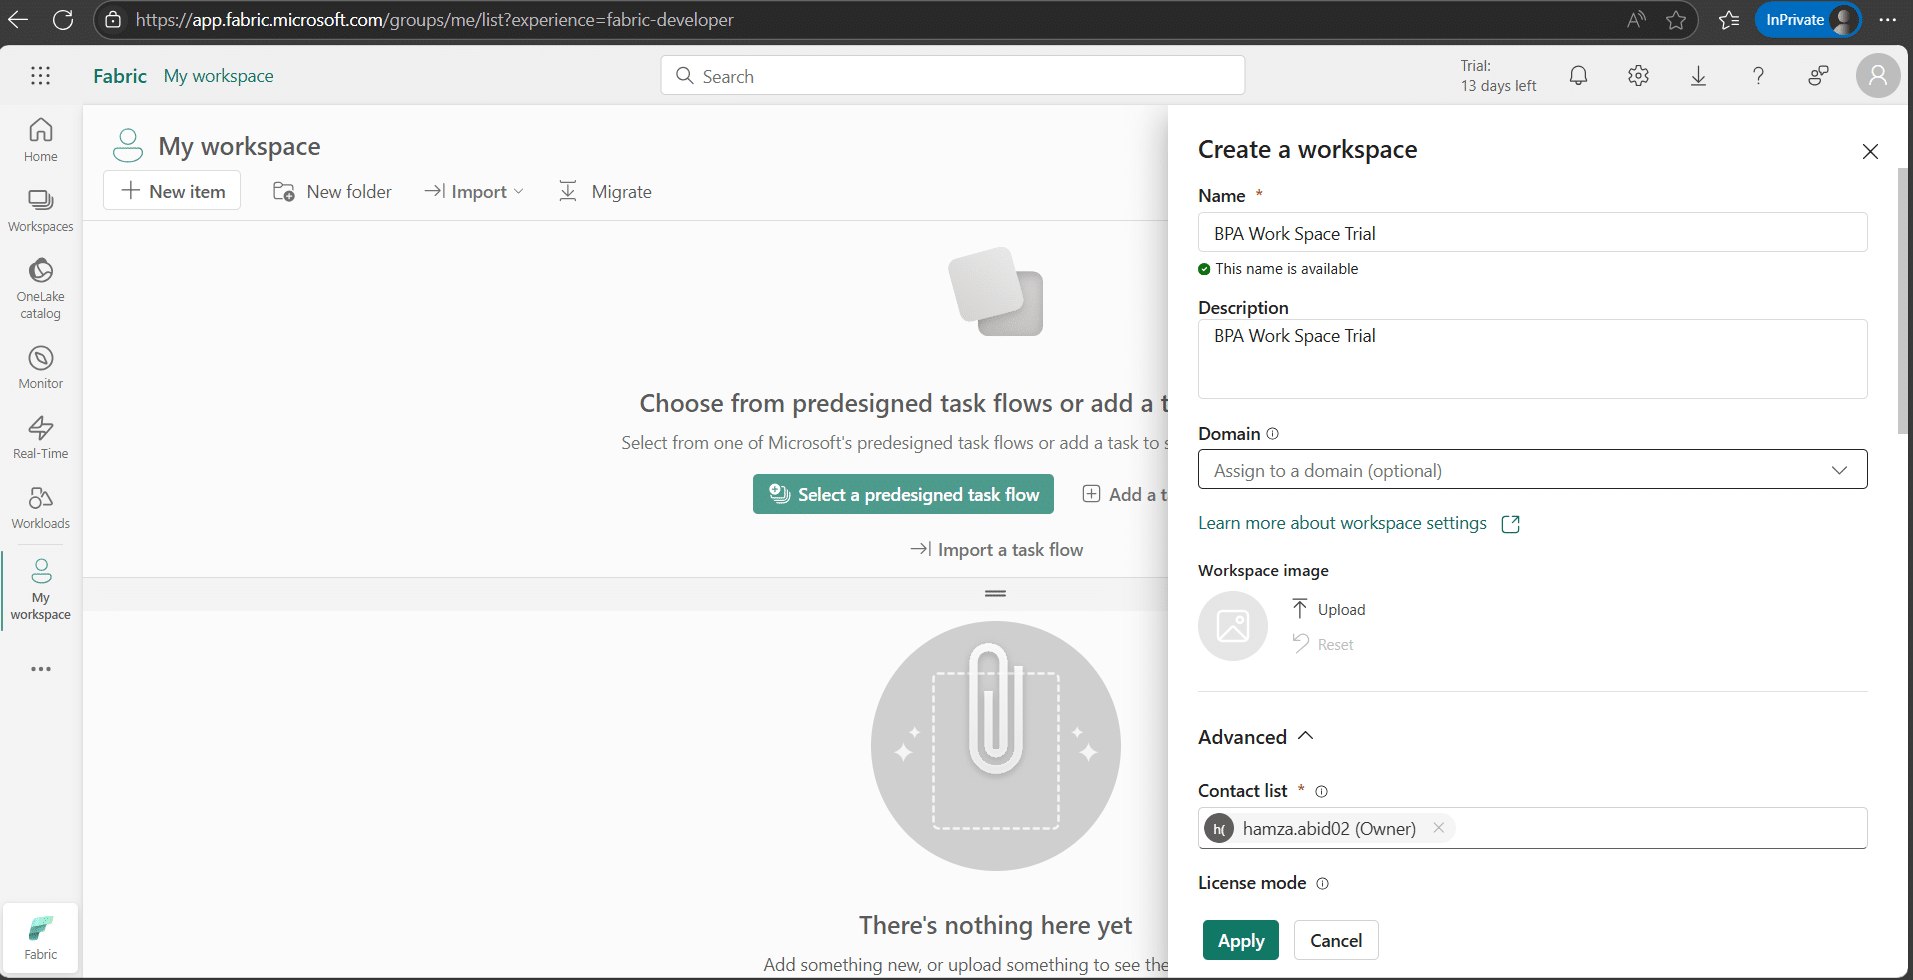
3- Enter the Name for the workspace.
4- Select license mode as “Premium Capacity.” Other license modes can also be selected. For more information, refer to the details at Connect Business performance analytics data to Microsoft Fabric (preview) – Finance | Dynamics 365 | Microsoft Learn.
5- Click Apply to create the workspace.
6- The workspace opens automatically upon creation.
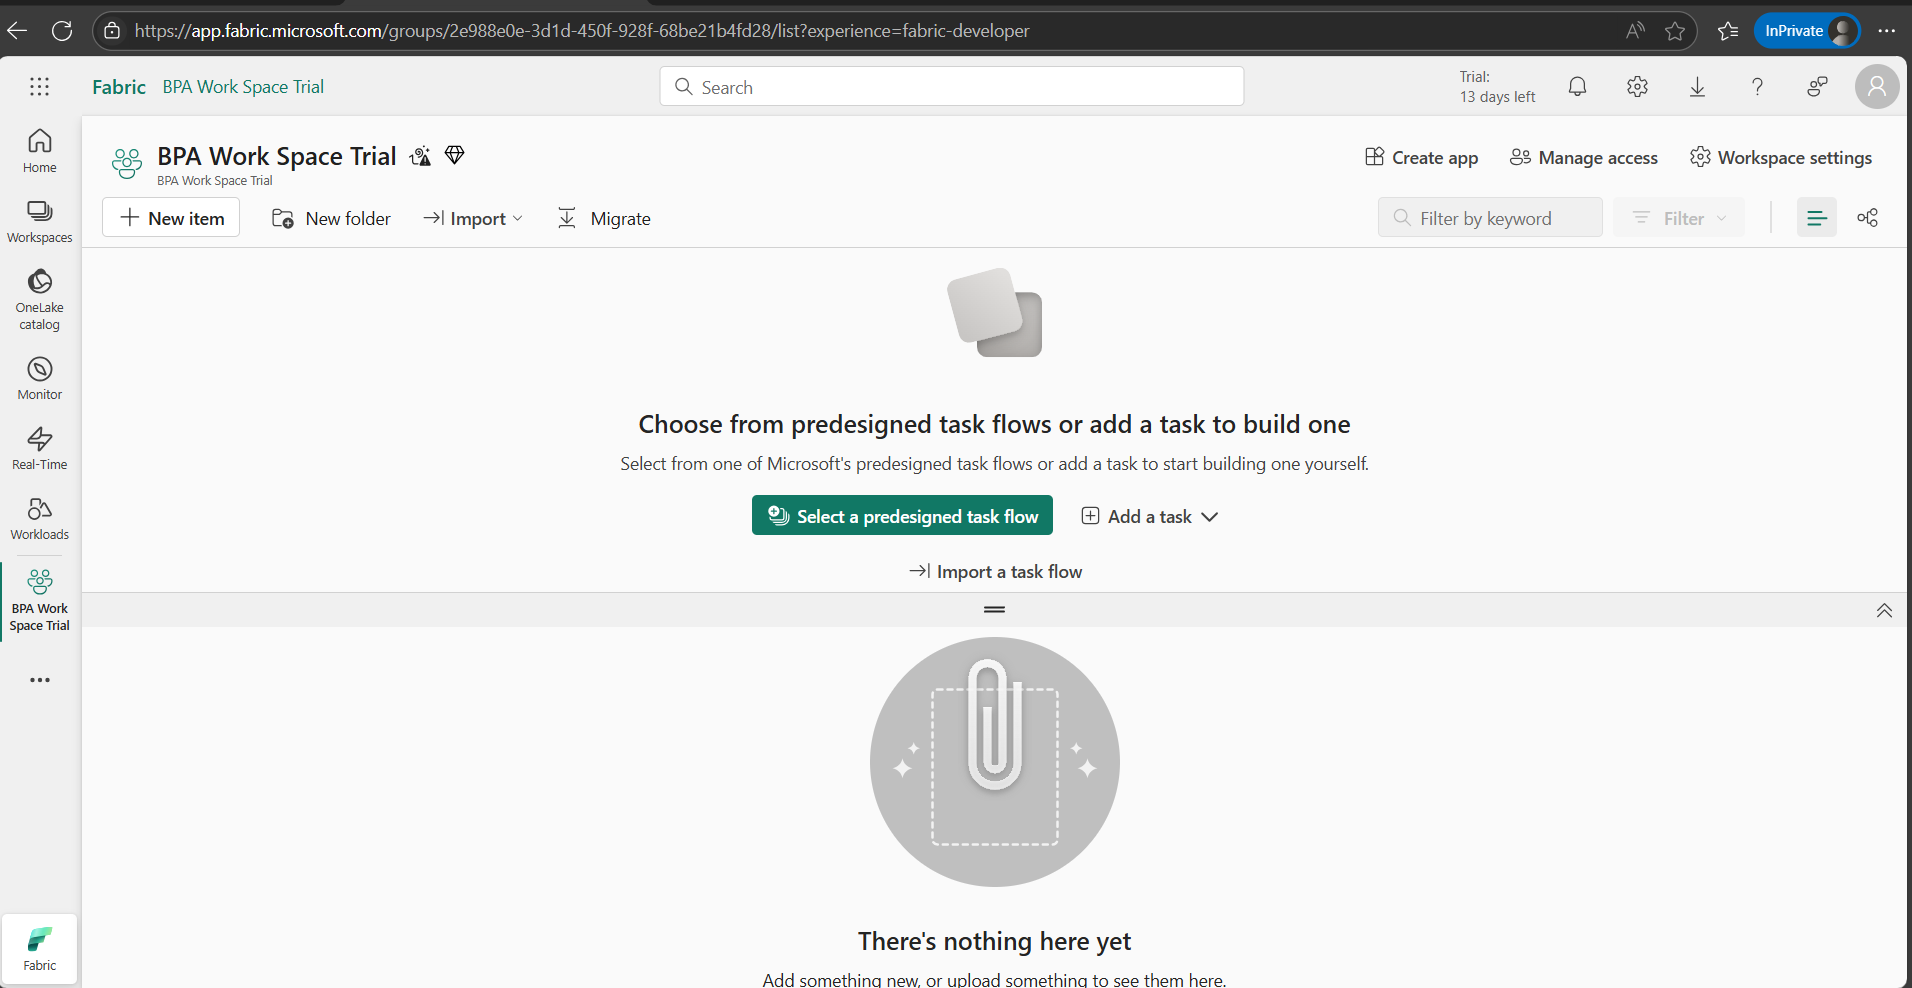
7- Note that we will use this workspace name to connect to Dataverse and to create a warehouse.
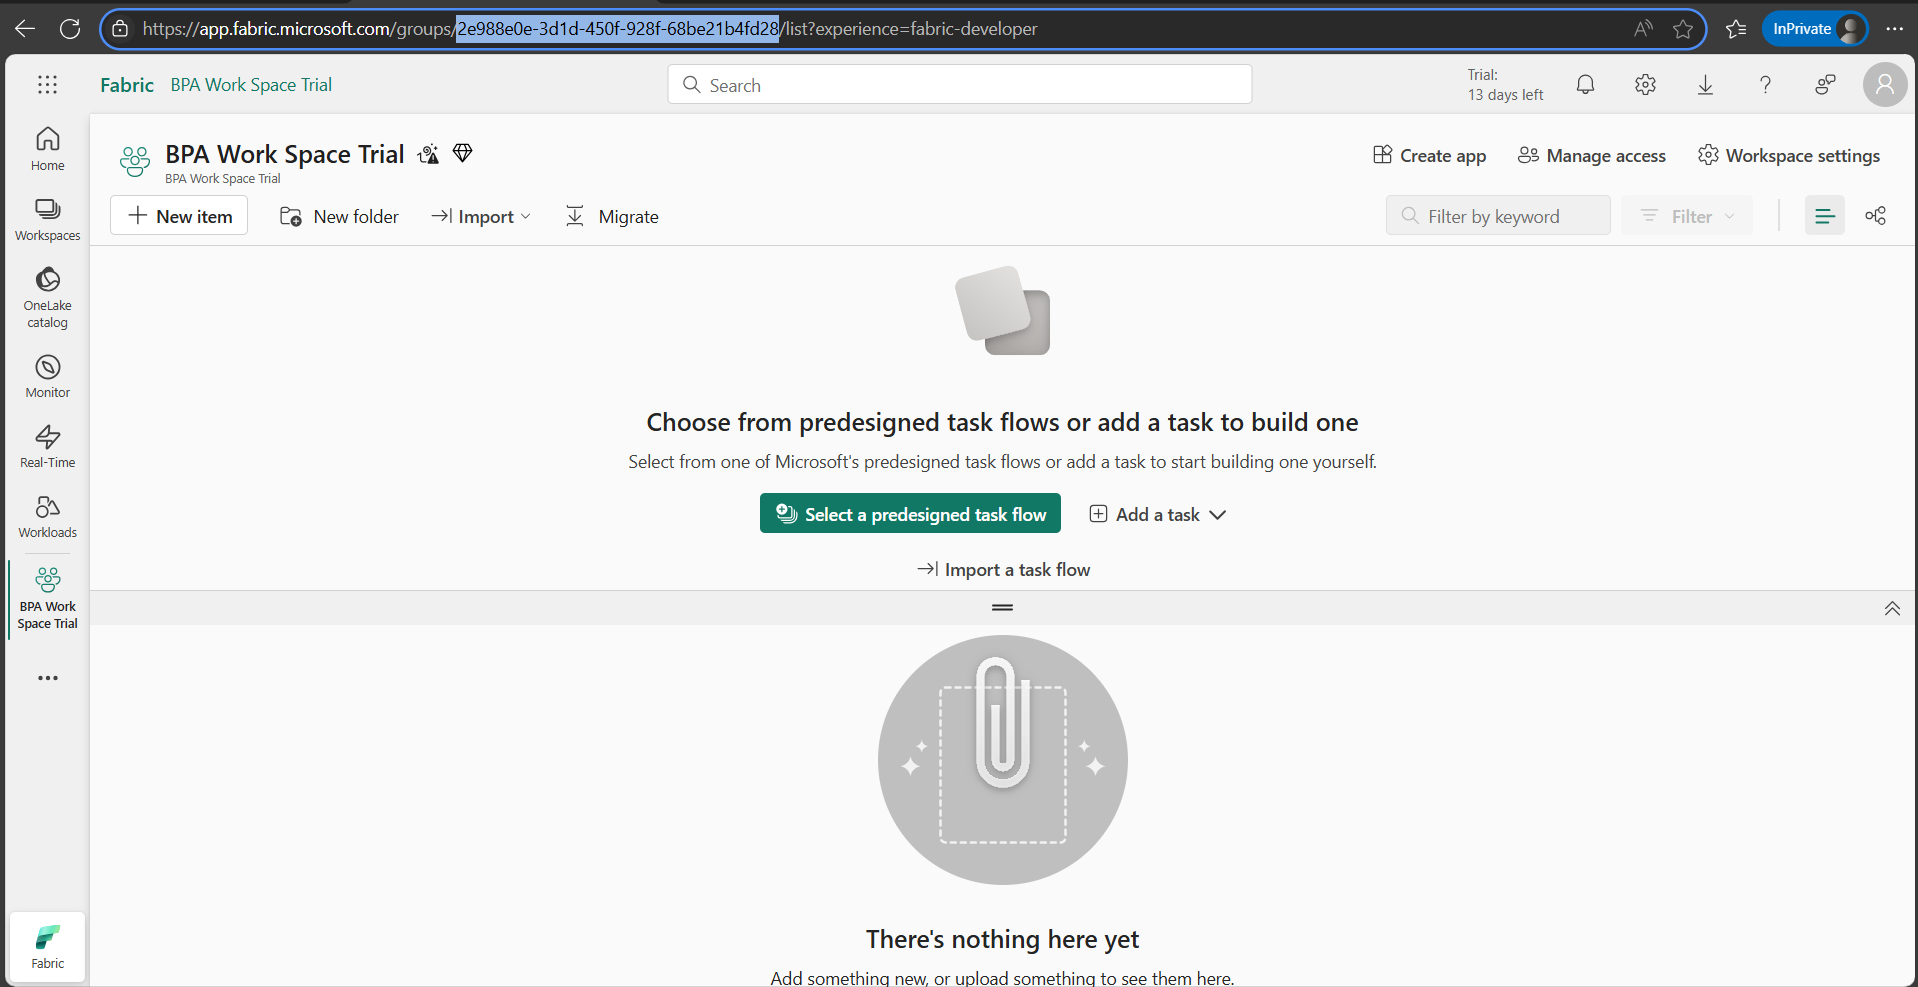
8- We will use the workspace ID to create a link to BPA. The workspace ID is part of the URL. Copy the ID from the URL and save it.
Take control of your business operations
Discover how Confiz services can simplify your complex workflows and improve decision-making.
Get a Free QuoteStep 2: Link Business performance analytics (BPA) data to Fabric workspace
To link Business performance analytics data to your organization’s Fabric workspace, follow these steps.
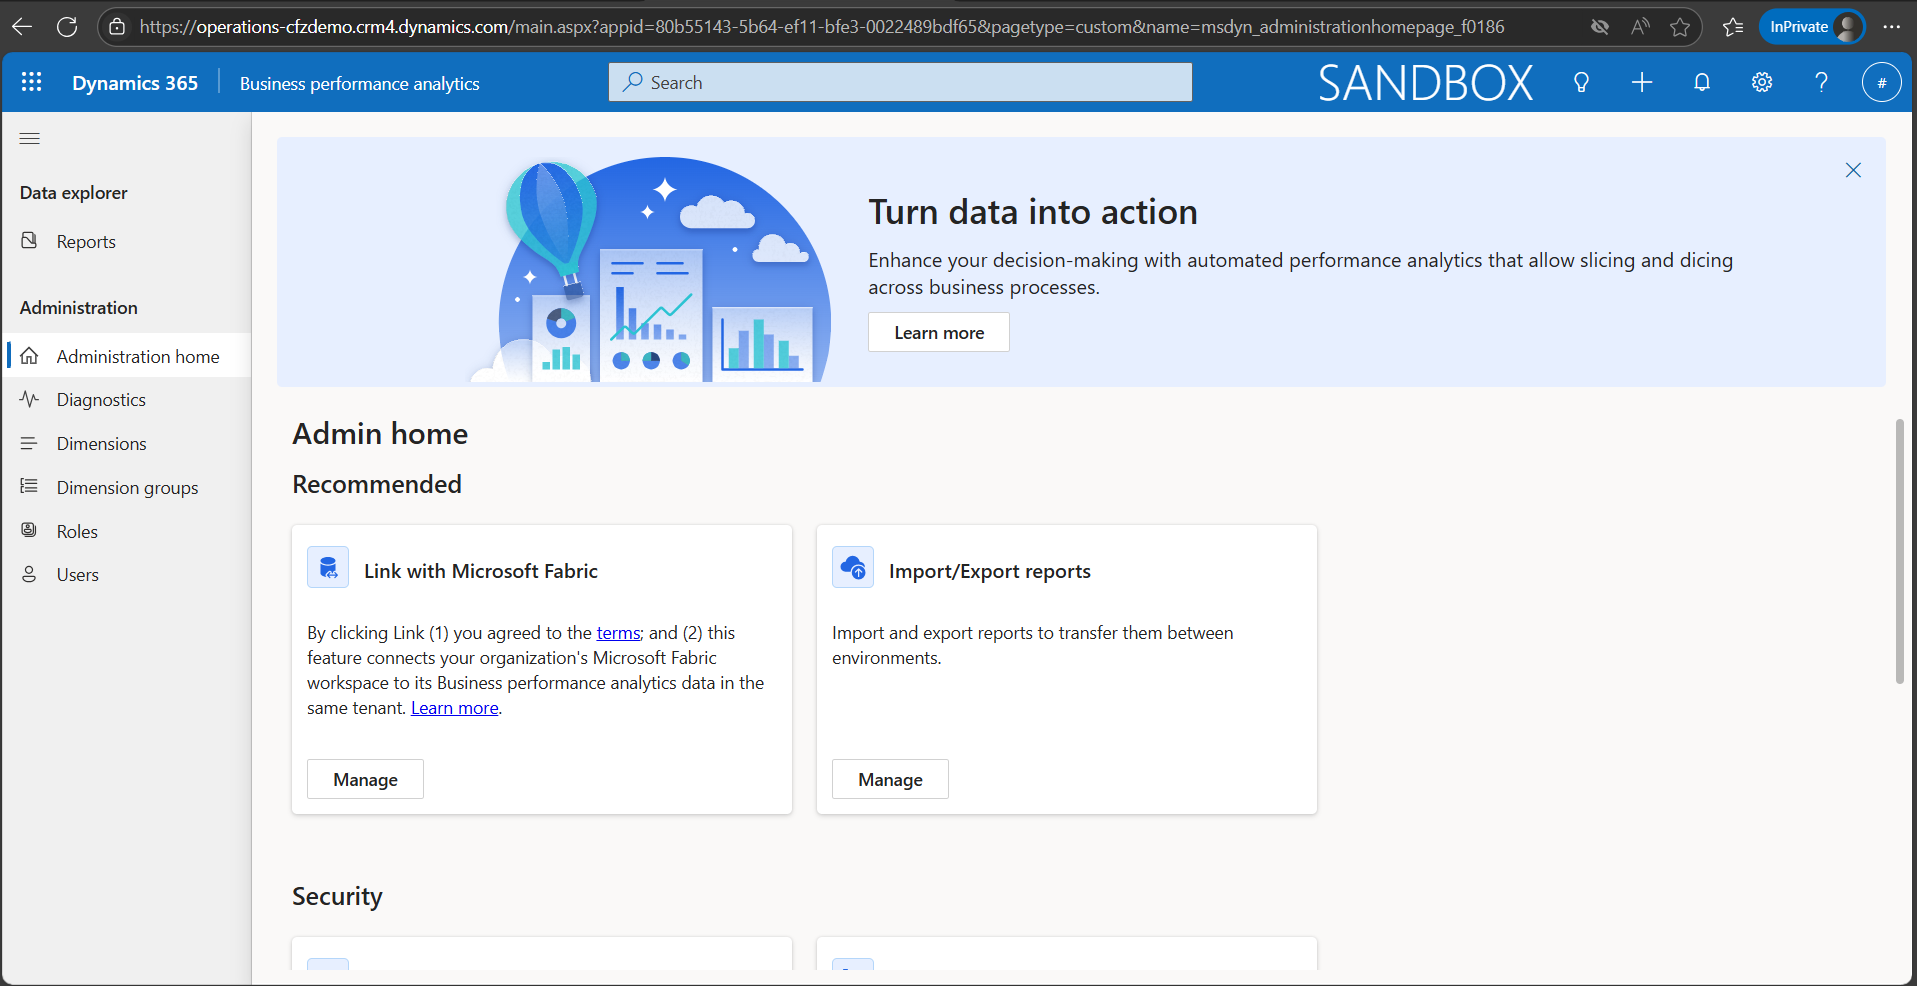
1- In Business Performance Analytics, select the Administration home tab.
2- Go to “Link with Microsoft Fabric” and select “Manage”.
3- Select Link Fabric.
4- Enter the Fabric workspace ID copied in the previous step to create the lake shortcut for the Business performance analytics dimensional model. Confirm that the workspace is linked to your business performance analytics Dataverse environment.
5- Select Connect. Creating Fabric shortcuts takes a few minutes.
6- In Business performance analytics, select the Administration home tab.
7- Go to Link with Microsoft Fabric and select Manage. The Fabric status must be created, and the Fabric workspace ID will be displayed.
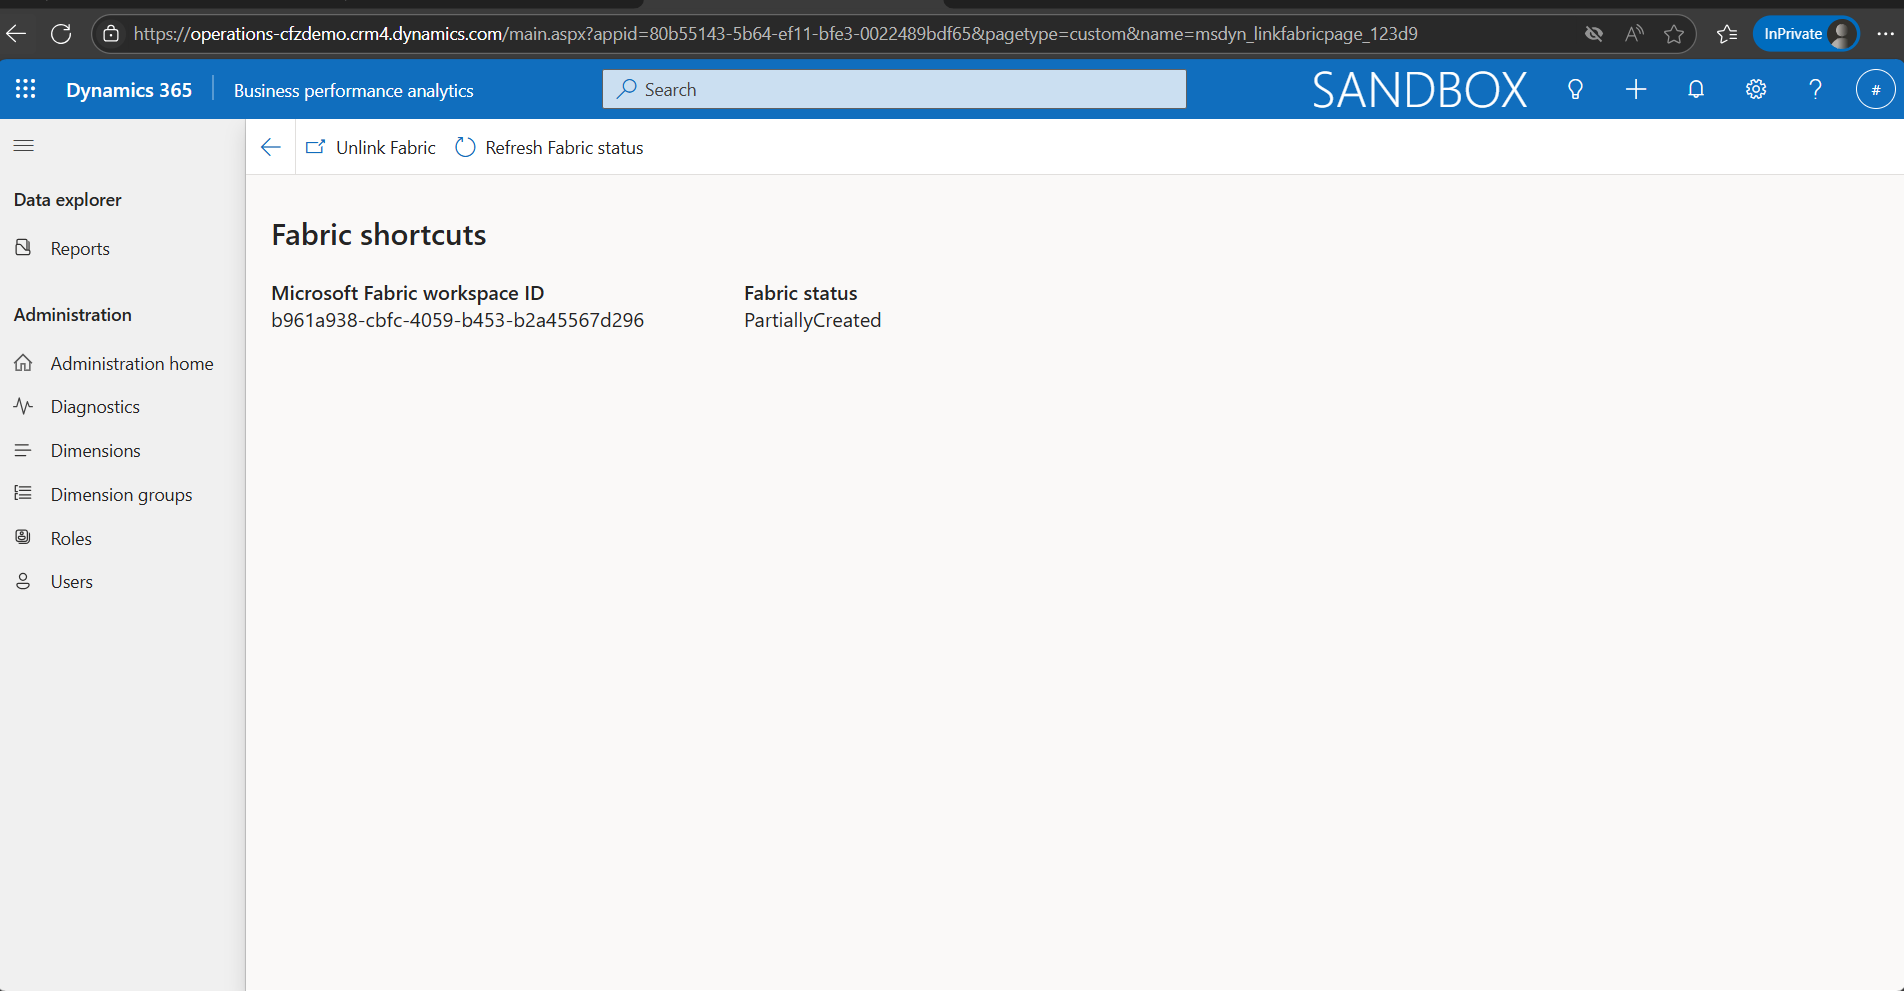
8- After the “Fabric status value” is created, select “View in Microsoft Fabric” to go to the linked Lakehouse in your Fabric workspace.
9- You should now be able to access Business performance analytics dimensional model tables via shortcuts in your Fabric workspace.
10- The Lakehouse, an SQL analytics endpoint, and a default semantic model are created, and Business performance analytics tables are linked to the Lakehouse via shortcuts.
Step 3: Link the Dataverse environment to Fabric
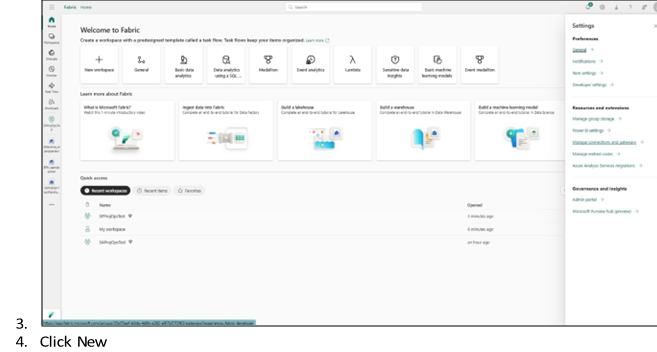
1- Log in to Fabric.
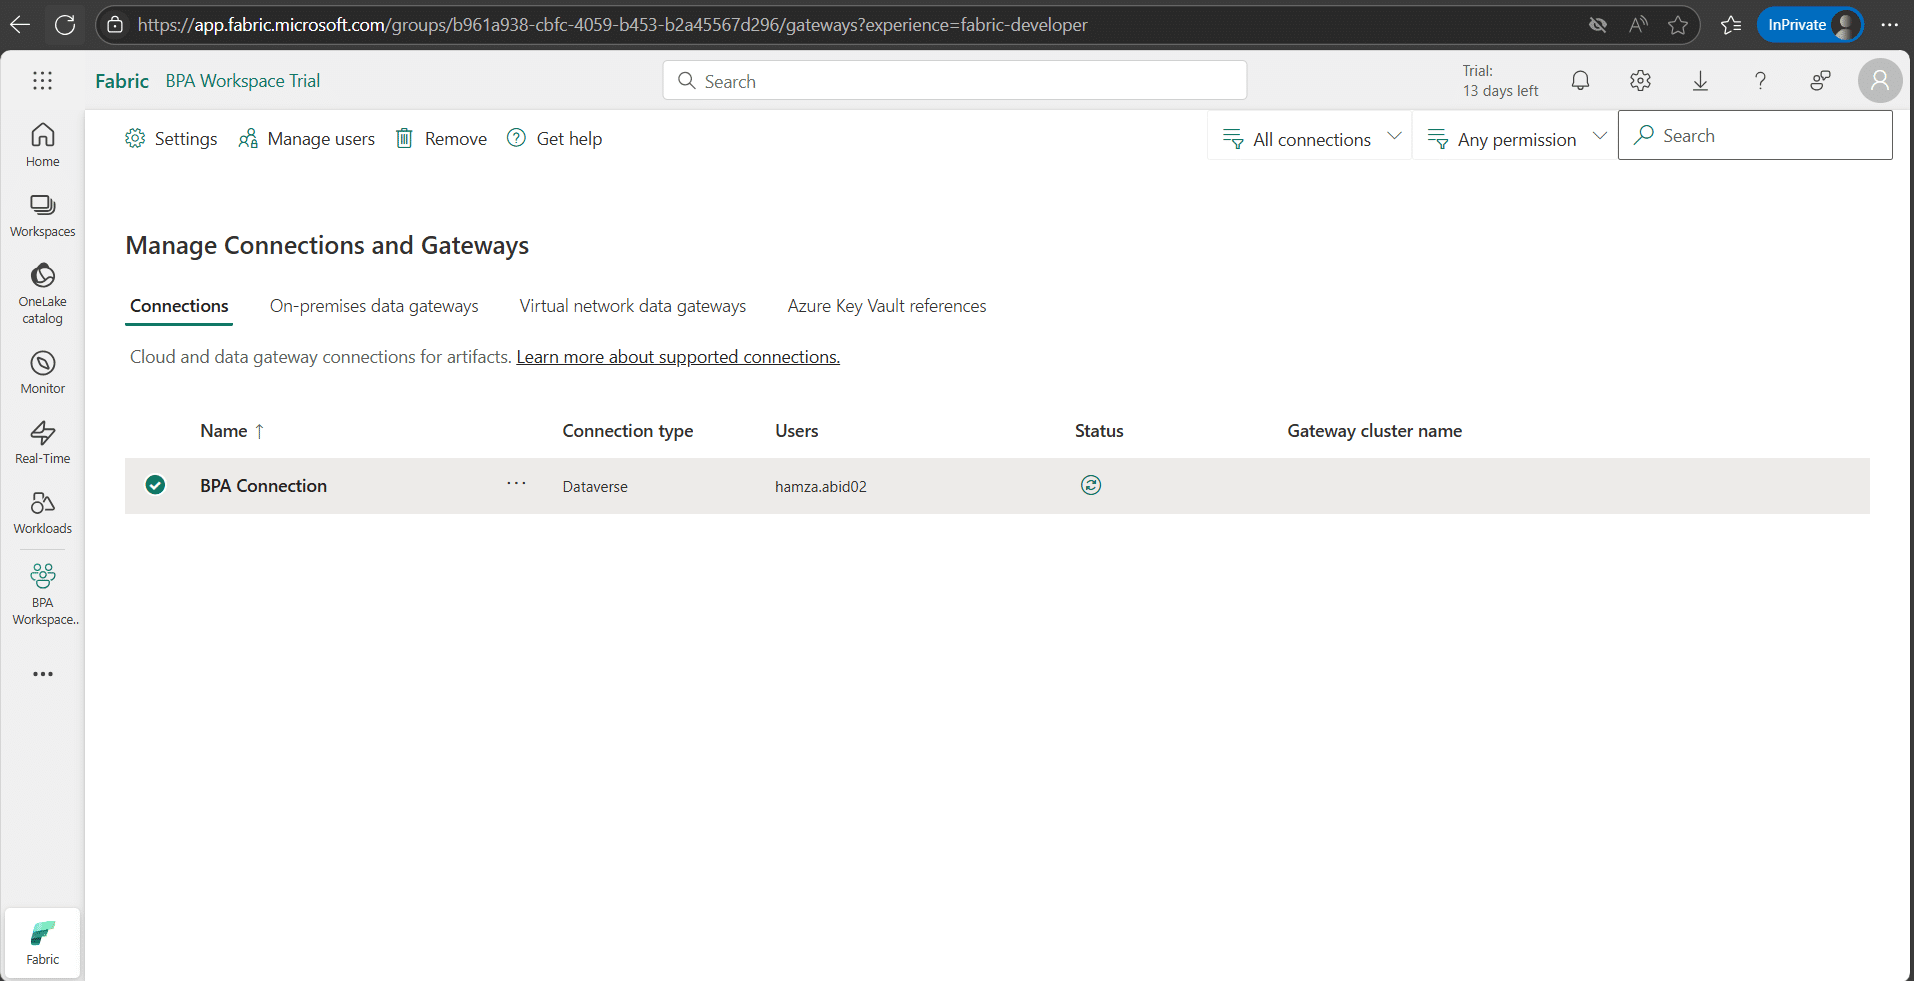
2- Click on the gear icon in the top right corner and then select “Manage connections and gateways.”
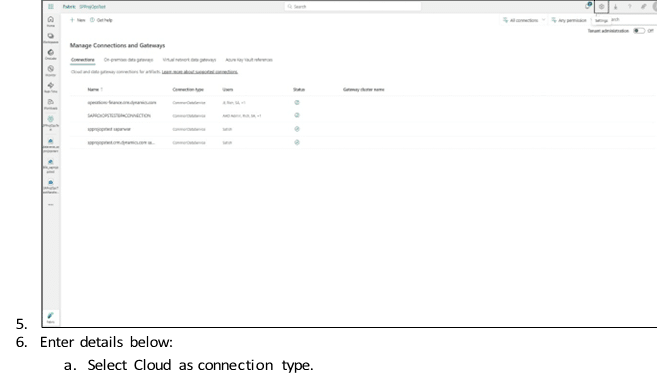
- Enter the connection name.
- Select Dataverse as a connection type.
- Enter URL (The environment URL that you enter should not start with
- “Https://” or end with a slash (/). Delete these elements if they are included e.g. “”).
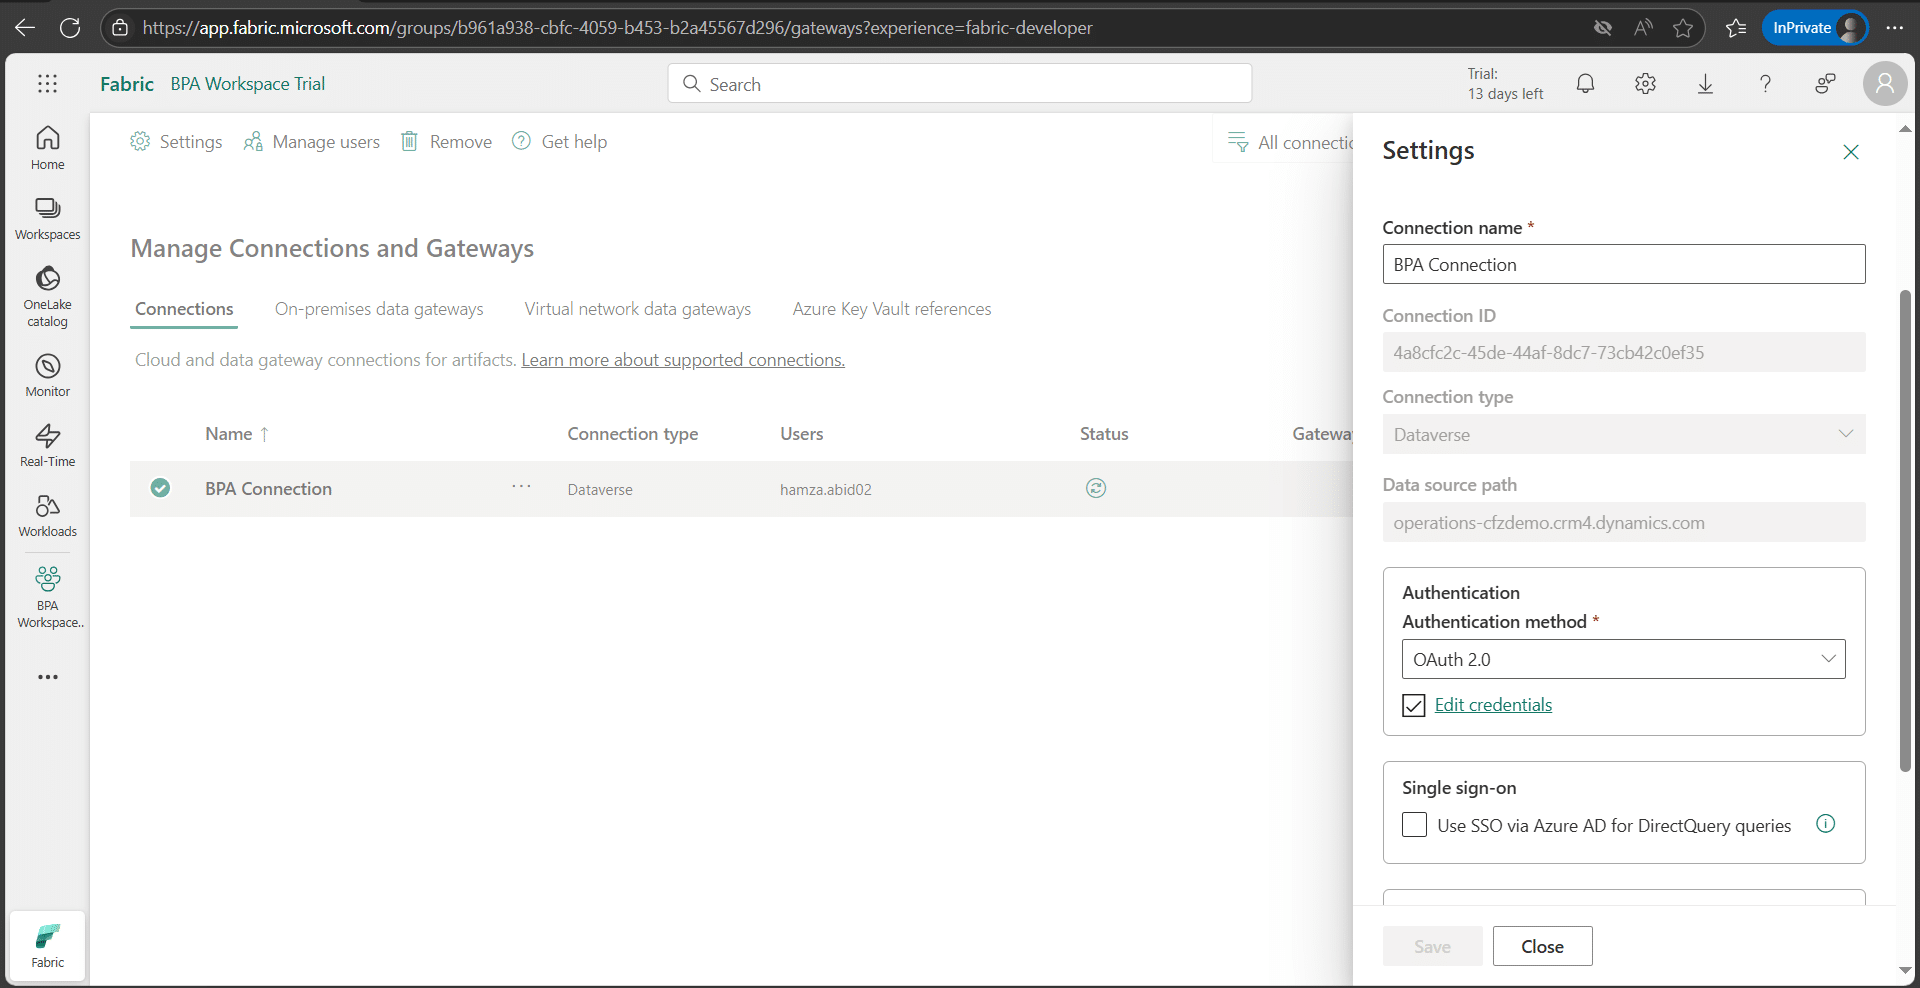
In the “Authentication method” field, select “OAuth2.0”.
- “Https://” or end with a slash (/). Delete these elements if they are included e.g. “”).
- Select “Edit credentials”, and complete authentication.
- In the “Encrypted connection” field, select “Encrypted”.
- In the “Privacy level” field, select “Organizational”.
7- Click “Create”.
8- Connection is created successfully.
Step 4: Enable Fabric link for Dataverse
1- Sign in to Power Apps.
2- Select the right environment from the Environment dropdown.
3- Click on Tables in the left pane.
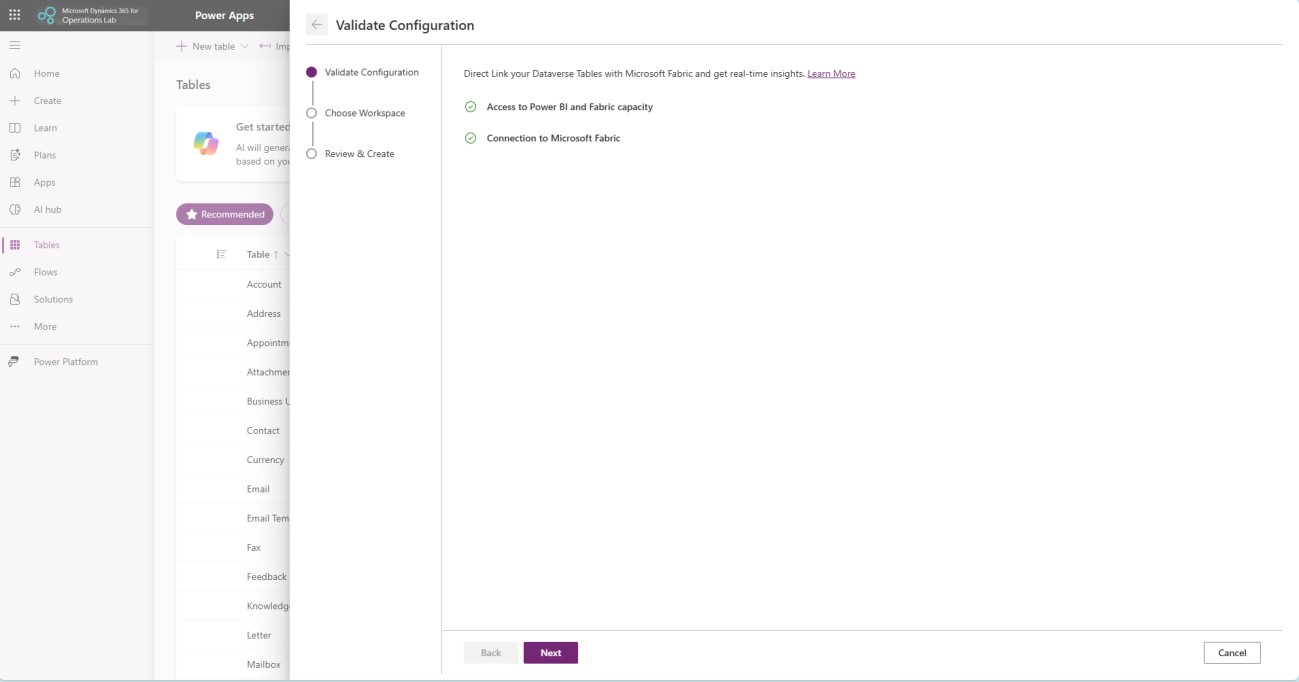
4- Click on Analyze > Link to Microsoft Fabric to initiate the connection to Fabric.
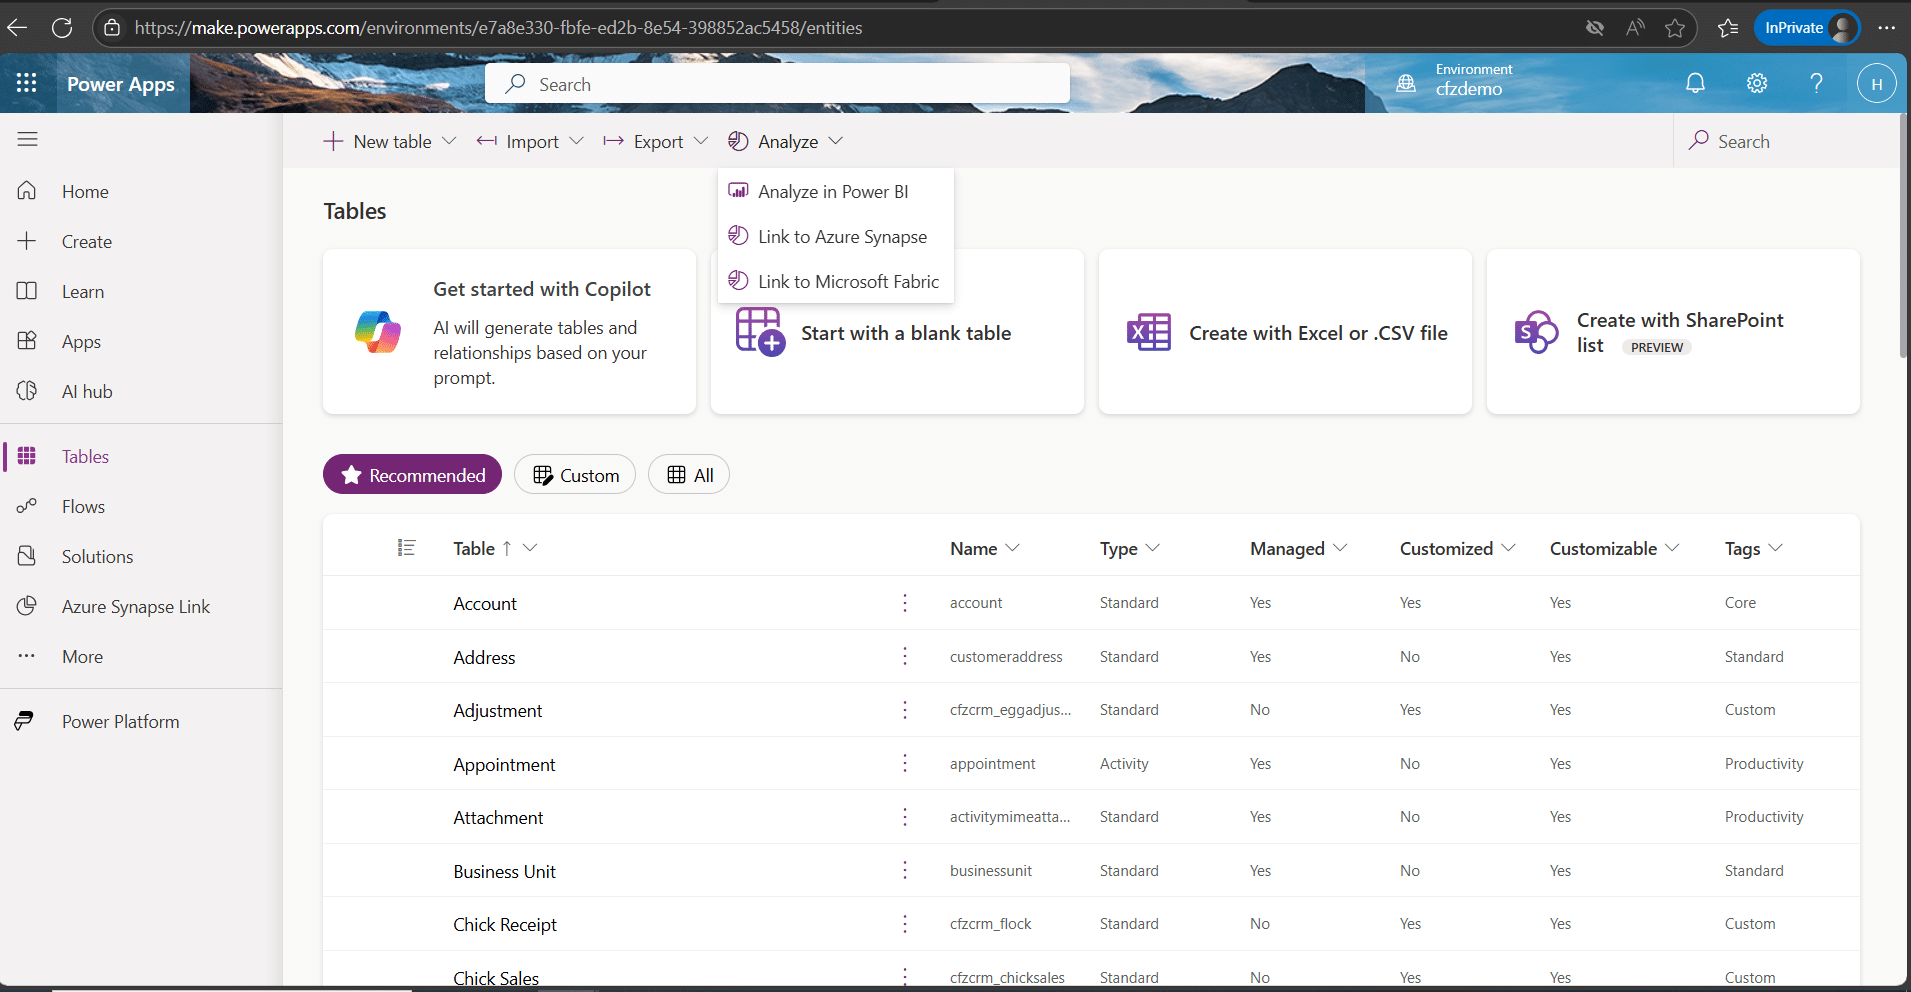
- The user should have access to Power BI and Fabric capacity.
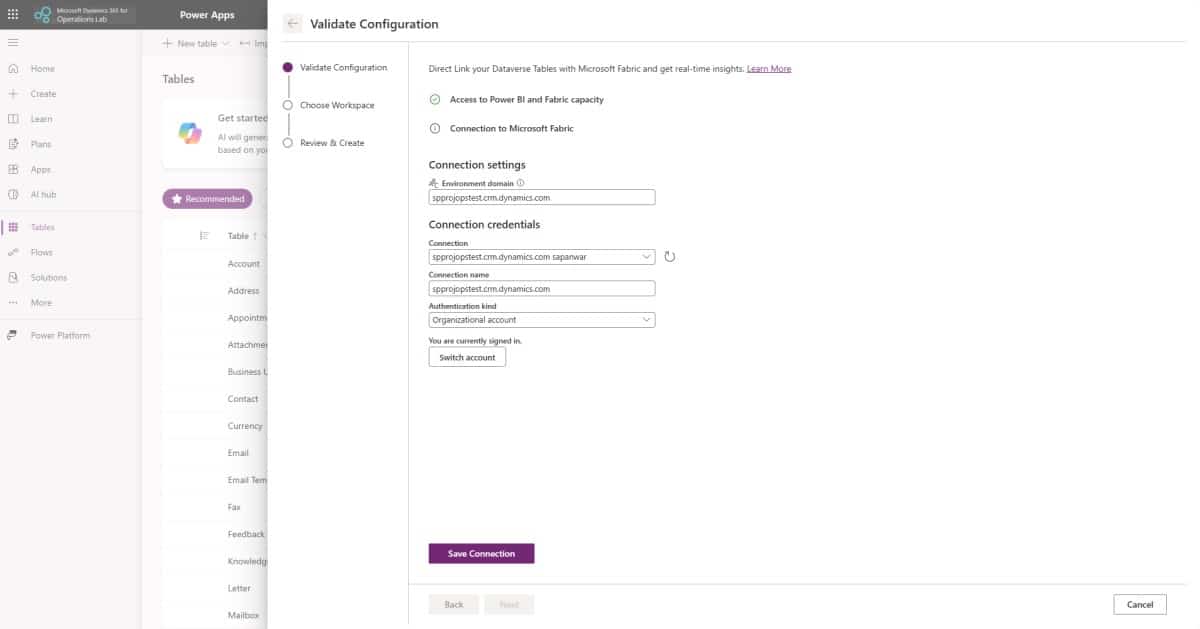
5- Enter connection details under Connection settings.
6- Enter environment domain details, i.e., URL for the environment.
7- Enter user-specific details. Notice that the Next button is greyed out.
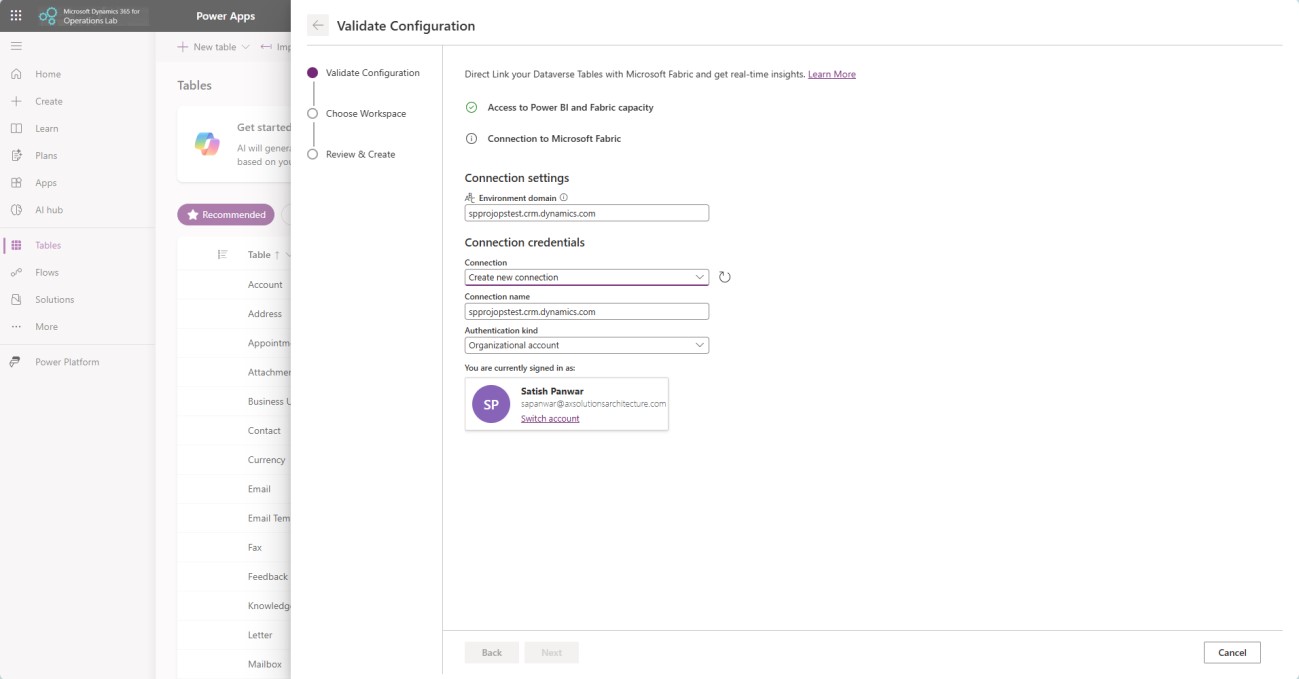
- Click on the username and sign in. Once signed in successfully, the save connection button will become visible.
8- Click “Save Connection”.
9- Click on the Next button.
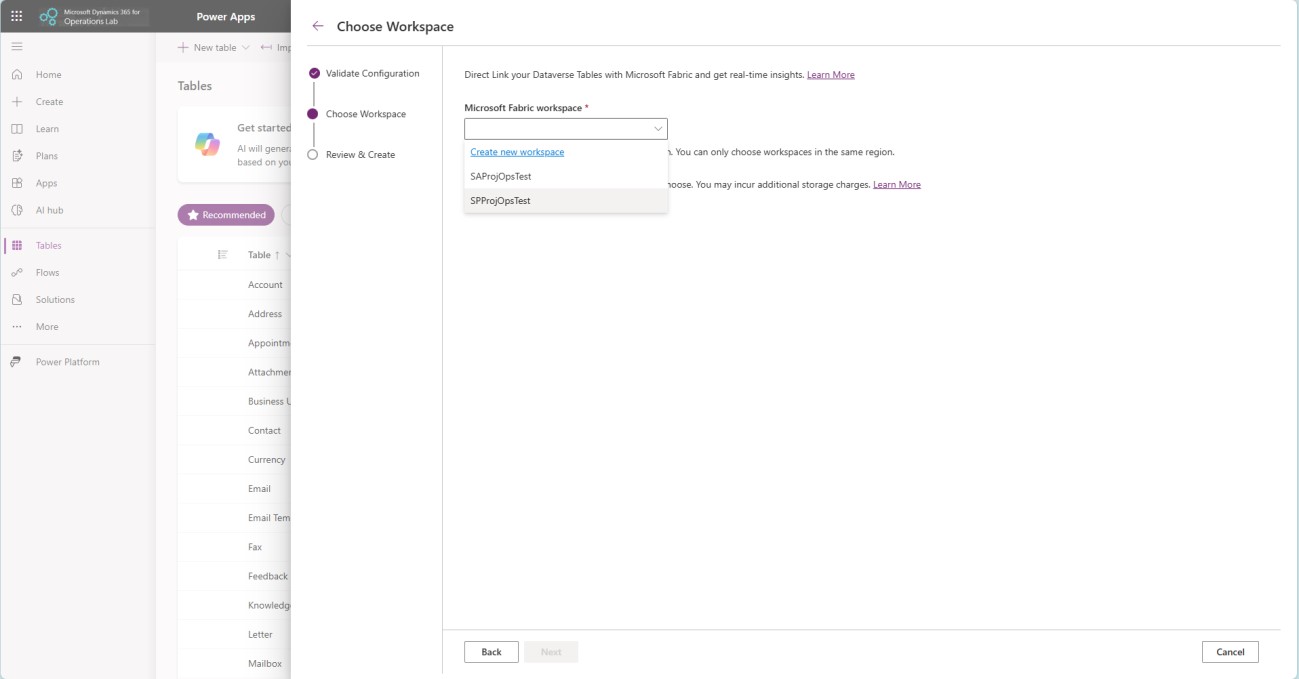
10- Select the Microsoft Fabric workspace that we have created previously. We need to ensure that BPA and Dataverse Fabric link are pointing to same workspace.
11- Click Next.
12- Click create to finish Fabric link creation.
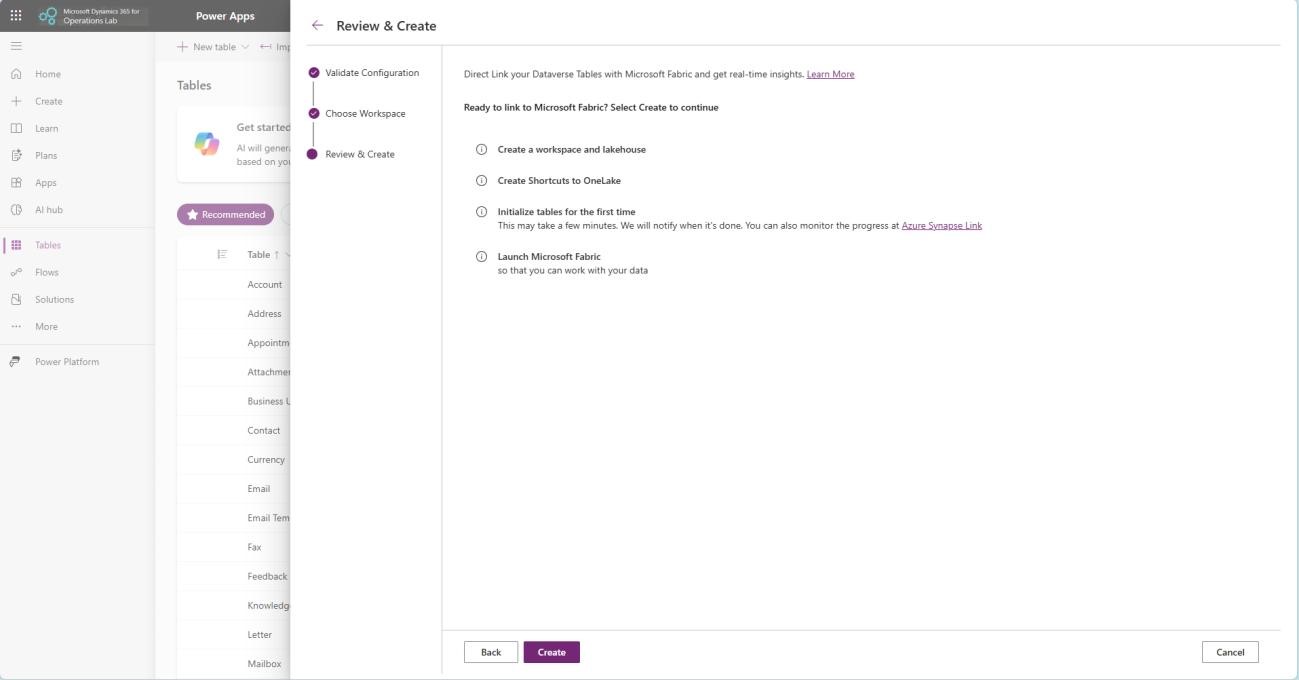
13- Fabric link creation is now completed.
Step 5: Enable tables from Dynamics 365 Finance in MS Fabric
1- Sign in to Power Apps
2- Select the environment in the top right corner.
3- Click on “Azure Synapse Link” in the left navigation pane.
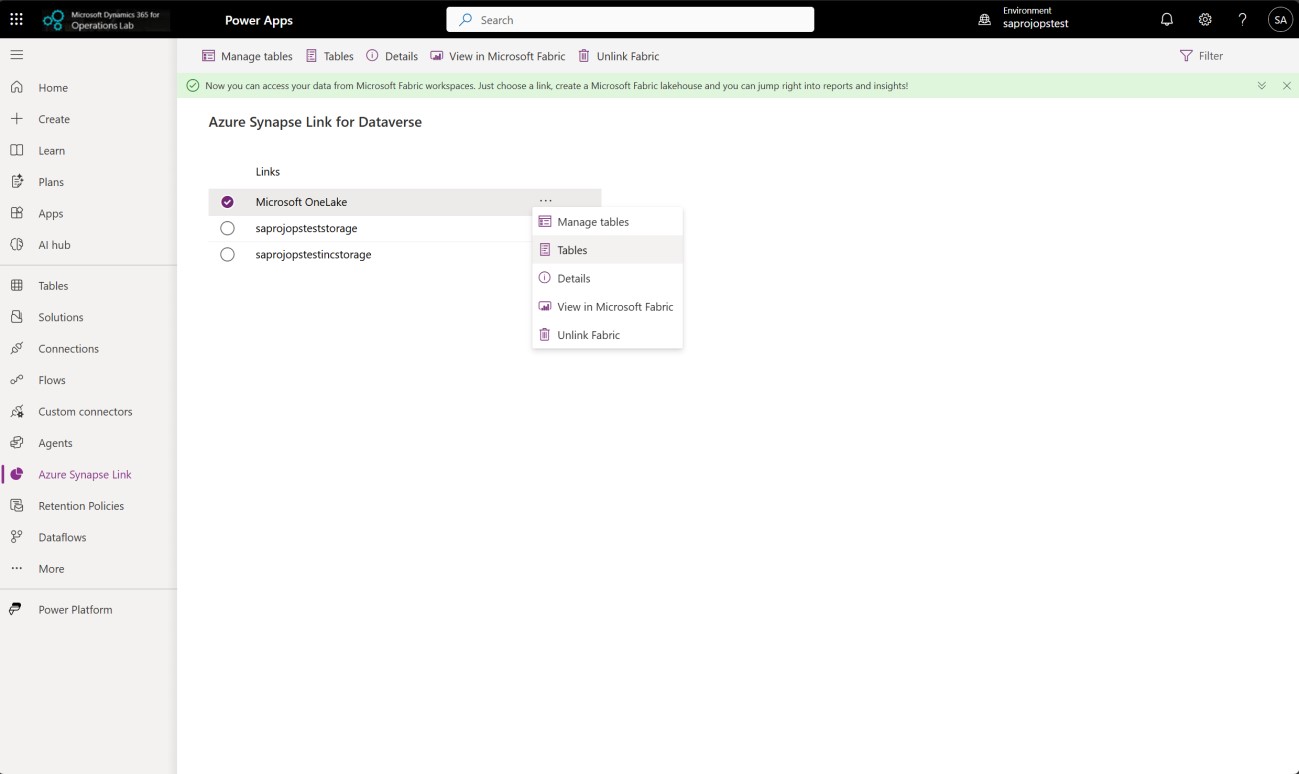
4- Select “Microsoft OneLake” and click on “…” and click “Manage tables”.

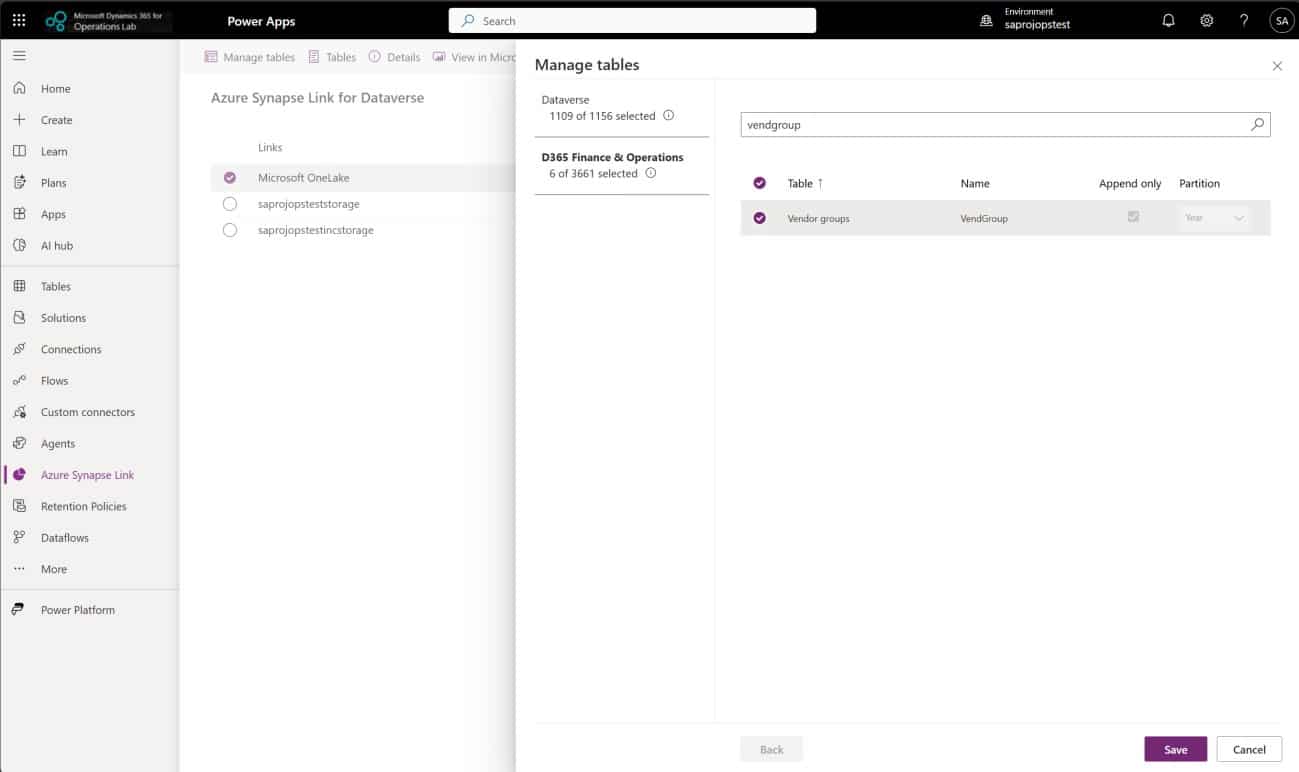
5- Once data is loaded on the Manage tables, the Dataverse tab can be used to select Dataverse-related tables. We will skip this tab and focus more on the D365 Finance and Operations tab.
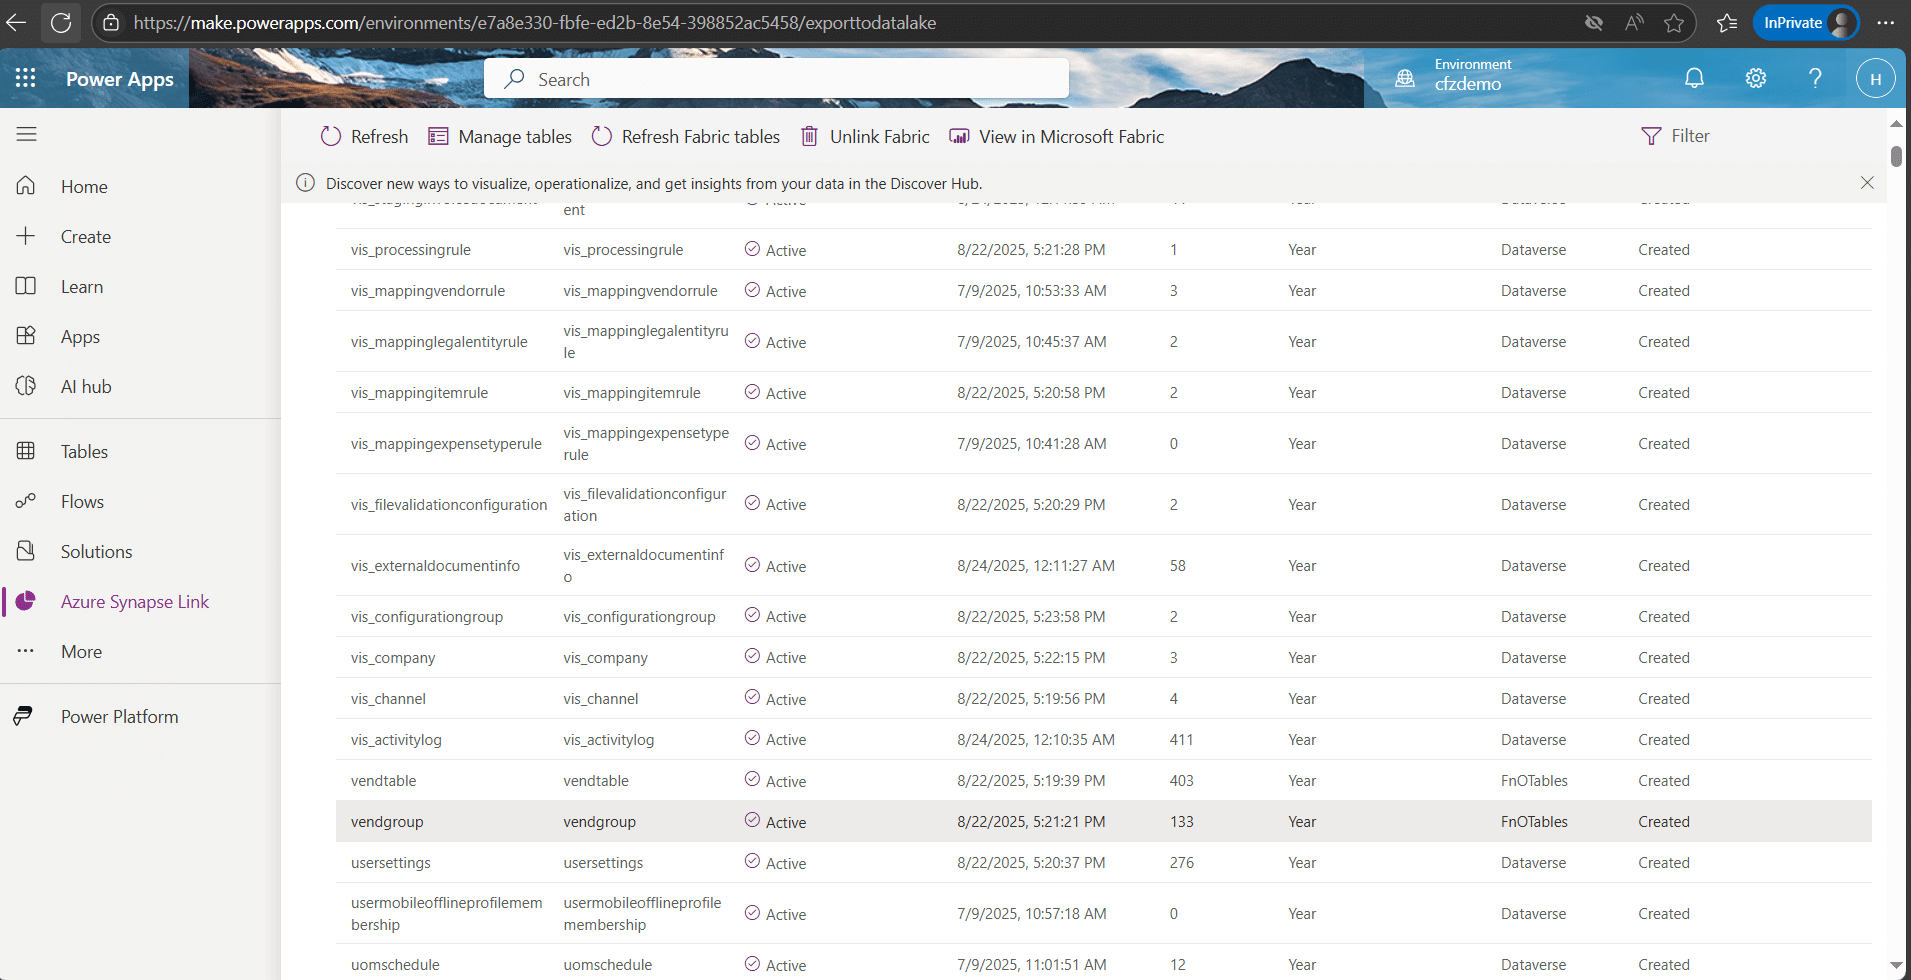
6- Go to the D365 Finance & Operations tab and search for the table VendGroup. Once the table is available in the results, select it as shown in the screenshot below.
7- Search “VendTable” next and select the table.
8- Once both tables are selected, click “save” to initiate the creation of these tables in Fabric.
9- Once the table is saved, the user is back to viewing Links on the “Azure Synapse Link tab”.
10- Select “Microsoft Onelake” and click on “Tables”.
11- Sync status for the table initially is “Initial sync in progress”.
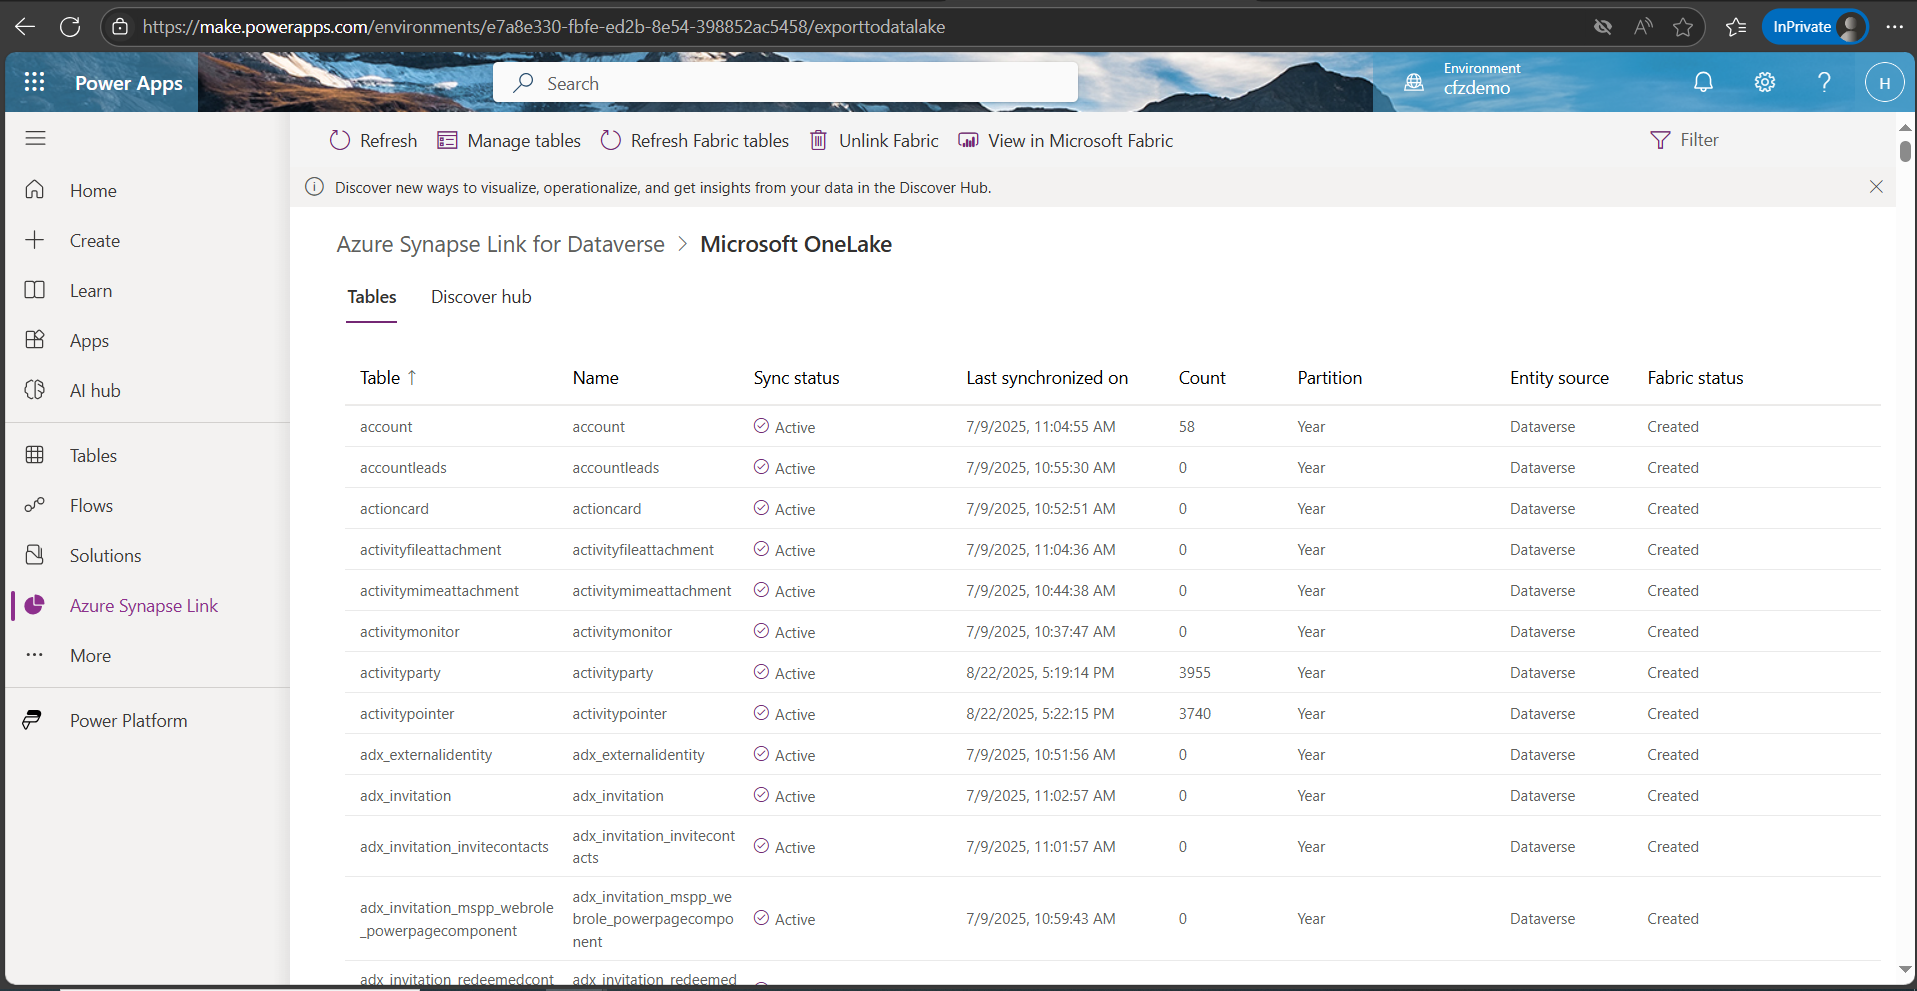
12- After a few minutes, the sync status is now Active. The Fabric status column value is not created yet.
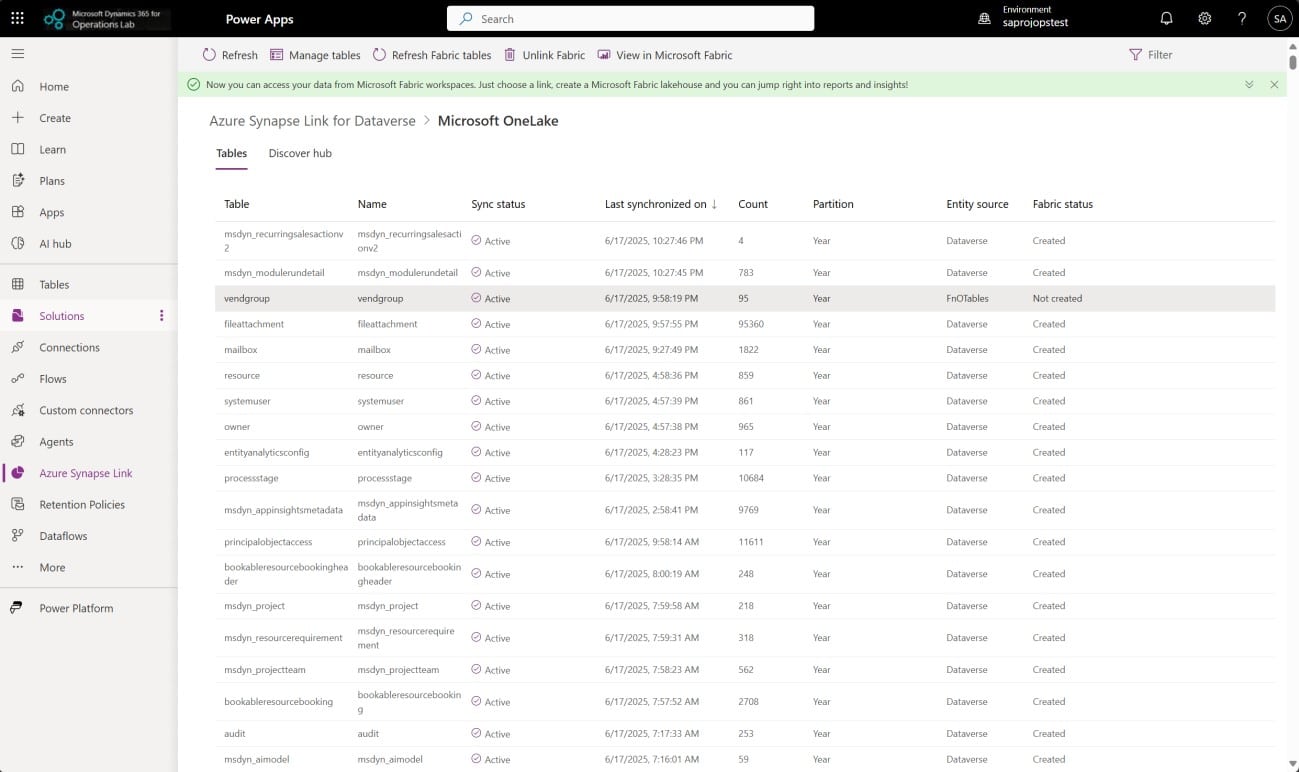
13- Click on “Refresh Fabric tables” to create the table in the Fabric workspace.

14: Once metadata sync to Fabric is completed, the status changes to “Created”.
Step 6: Creating a Warehouse in Fabric
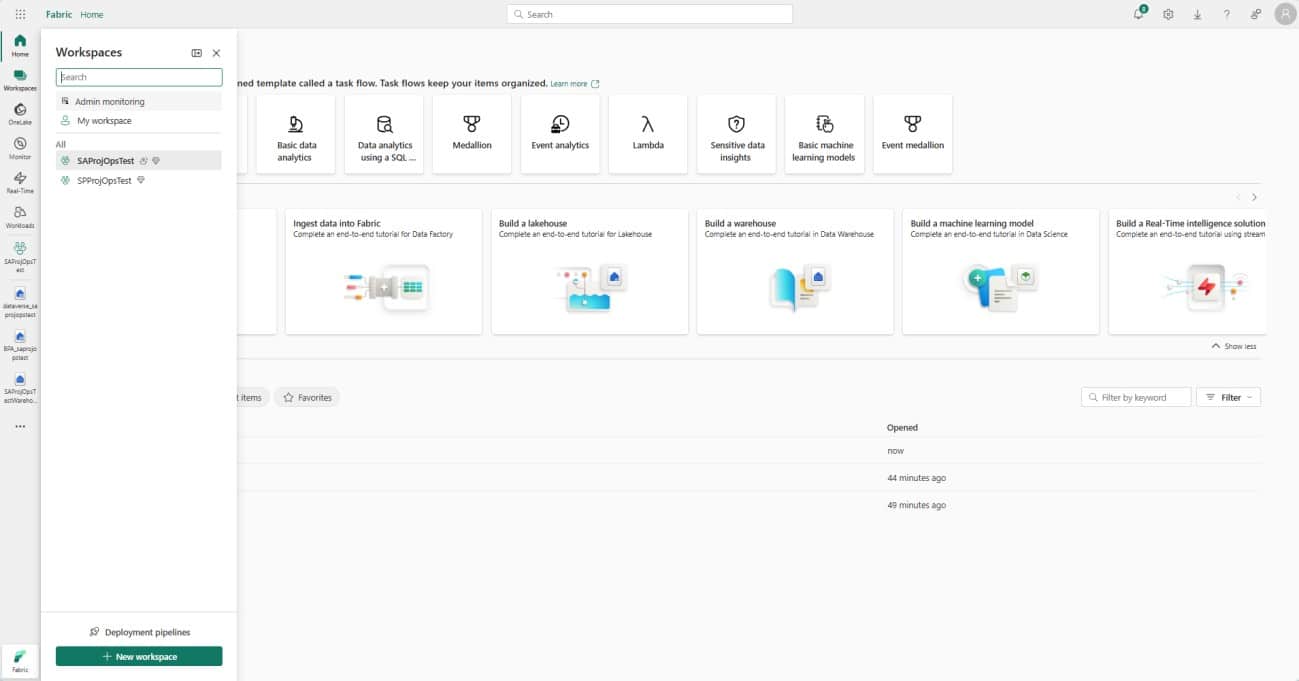
1- Sign in to Fabric.
2- Click on the Workspaces and select the workspace created in the previous steps.
3- In the screenshot below, we see 2 Lakehouses and one warehouse.
4- Lakehouse BPA_saprojopstest is linked to BPA and created as part of the link to Fabric. Detailed steps provided above.
5- Lakehouse dataverse_saprojopstest is linked to Dataverse and created as part of the link to Fabric. Detailed steps provided above.
6- A warehouse will be created now, and detailed steps are provided below. 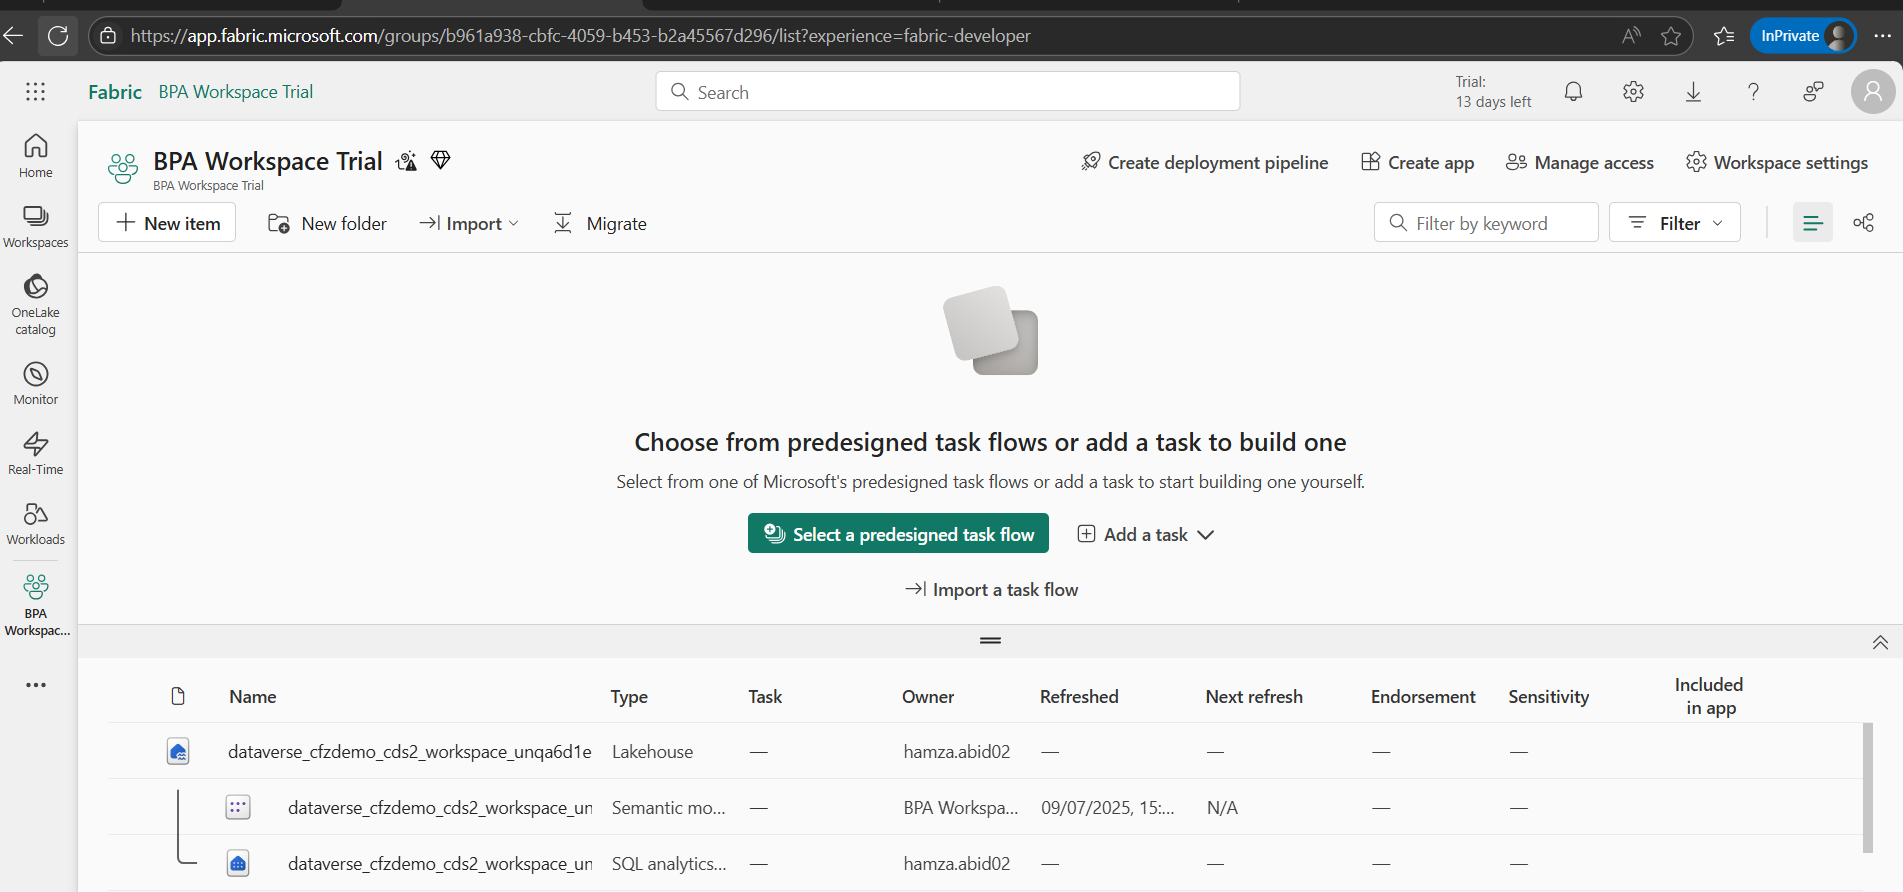
7- Click on the new item.
8- Select a warehouse. 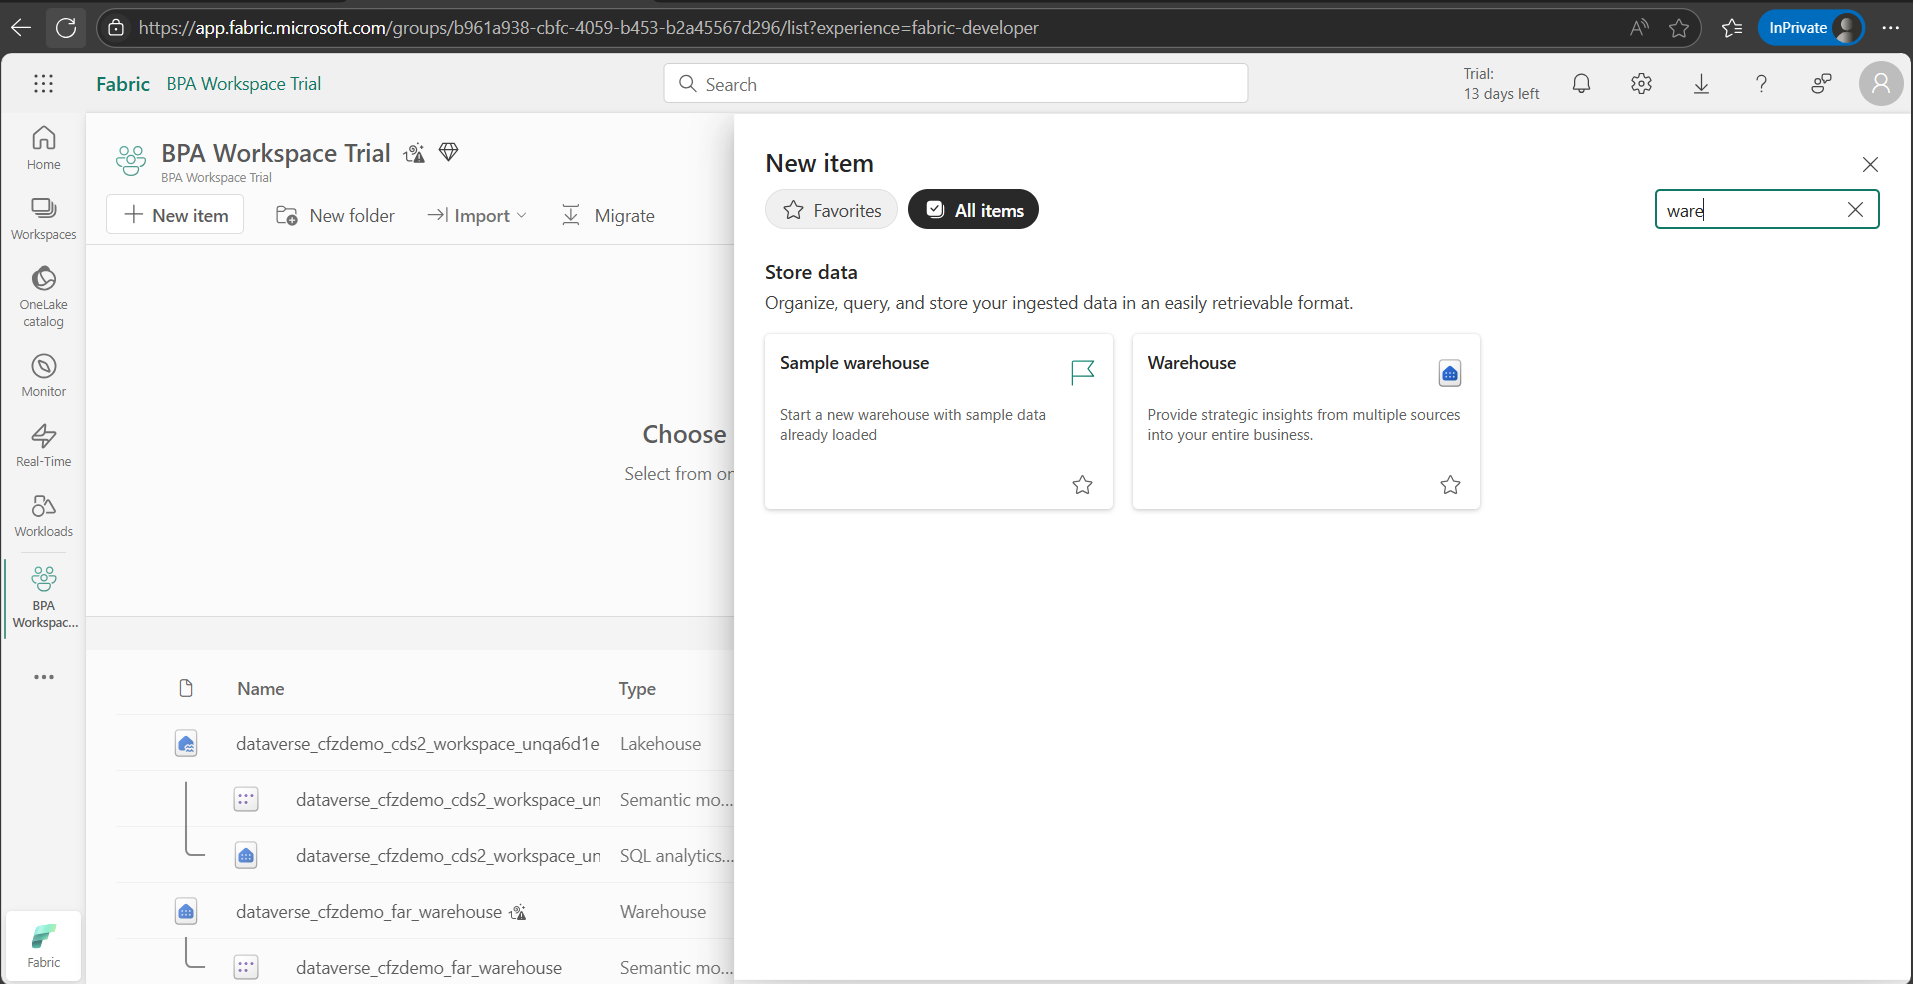
9- Enter name and click Create. 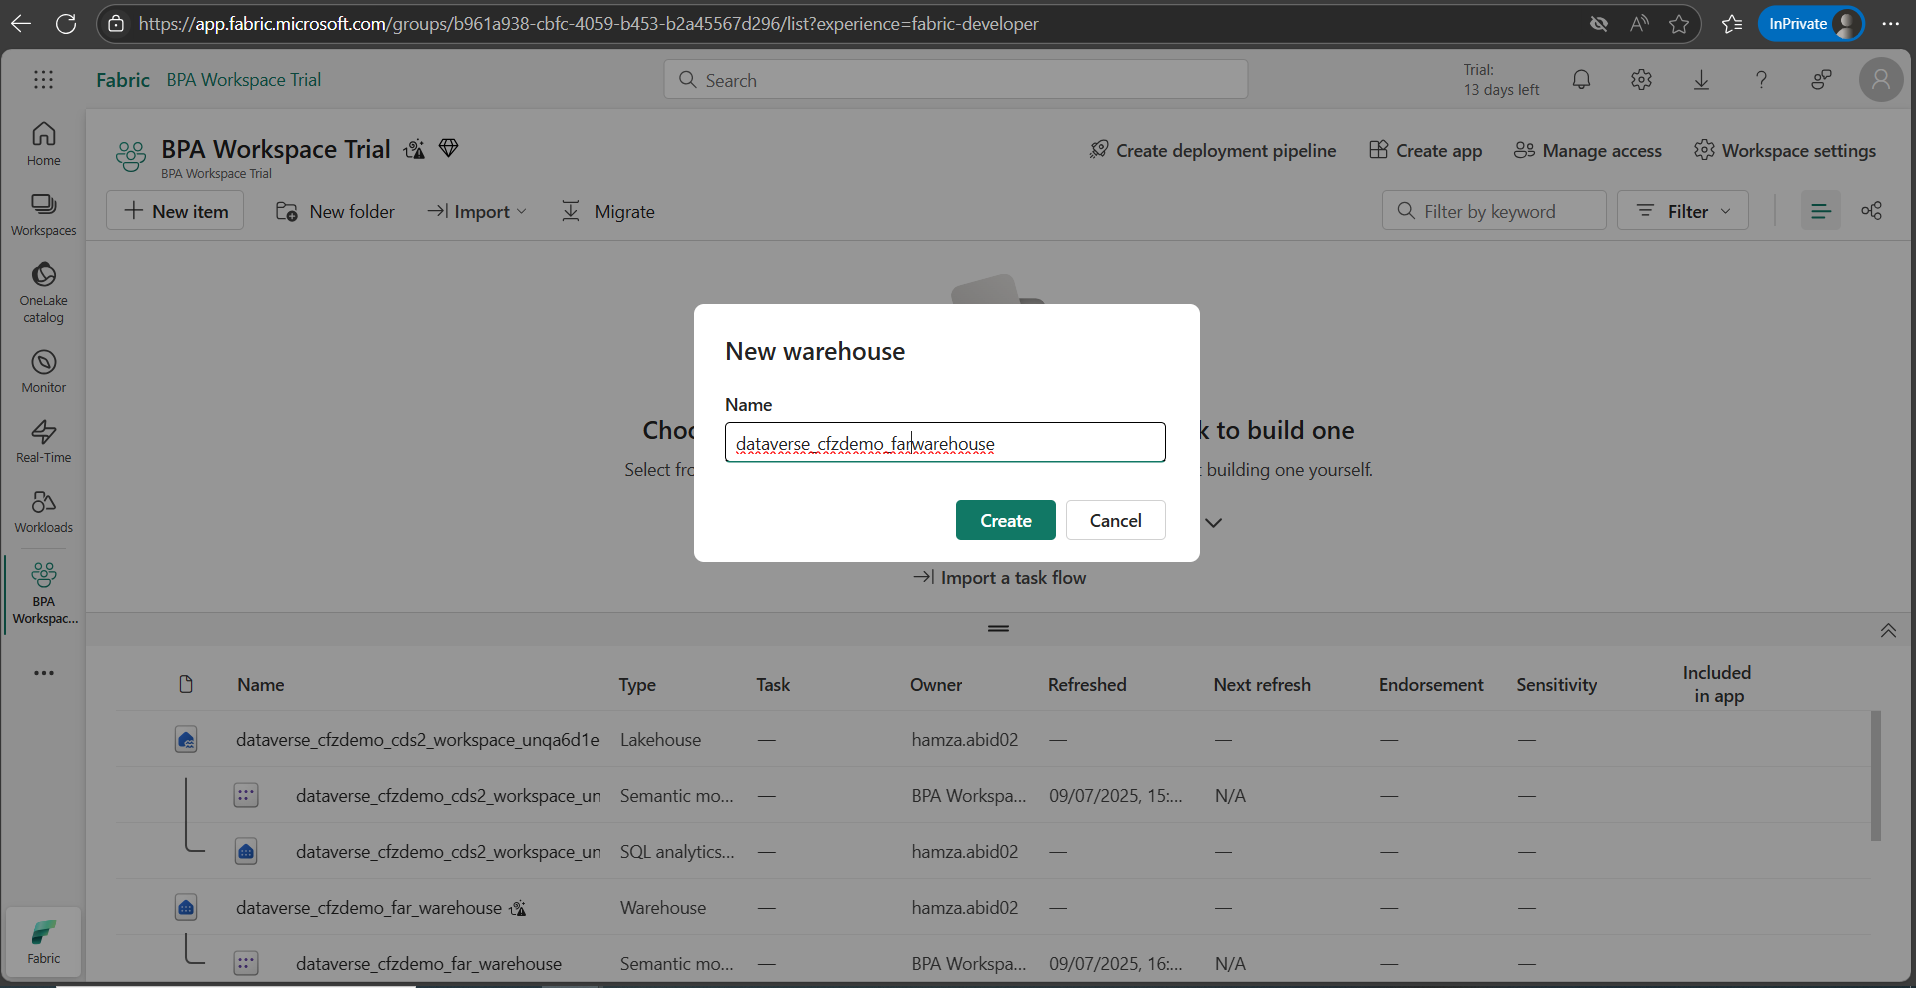
10- The warehouse is created successfully.
11- Next, we will work on creating data in the warehouse.
12- Under the workspace, click on the Warehouse name. 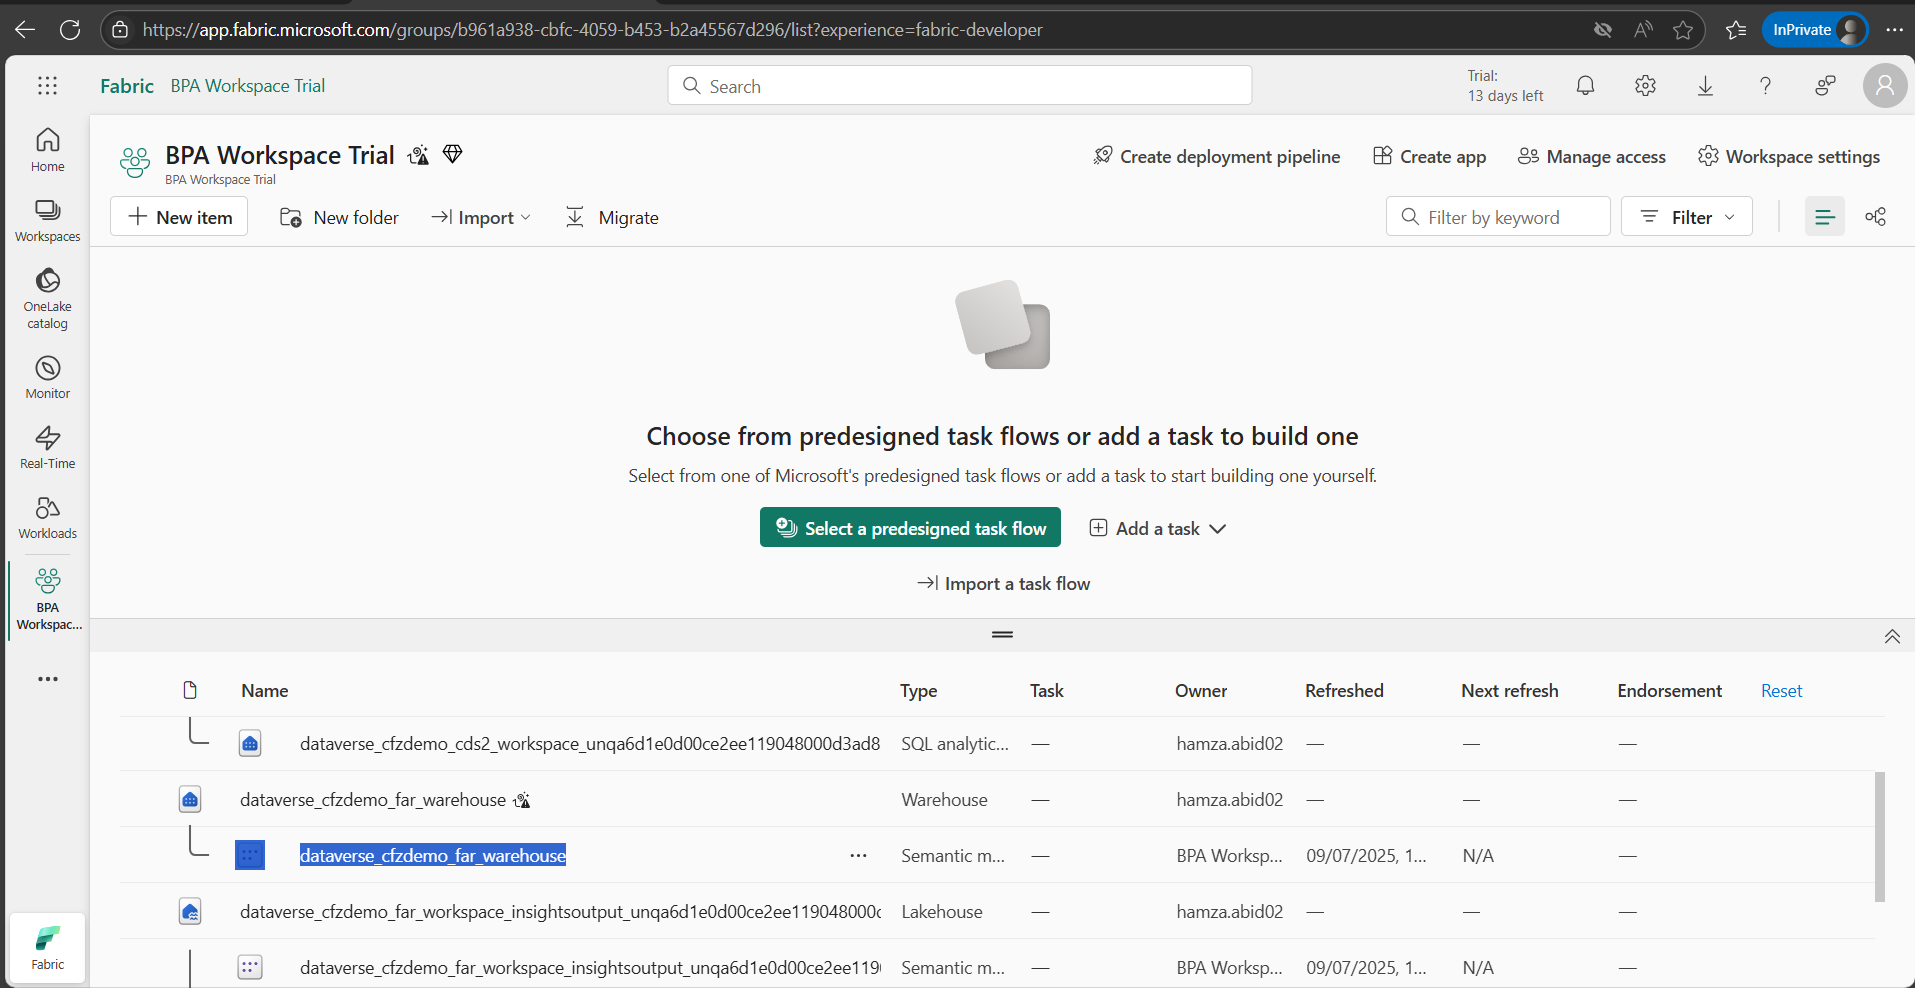
13- Under My queries, click New SQL Query
14- Create a new view using the SQL statement below. 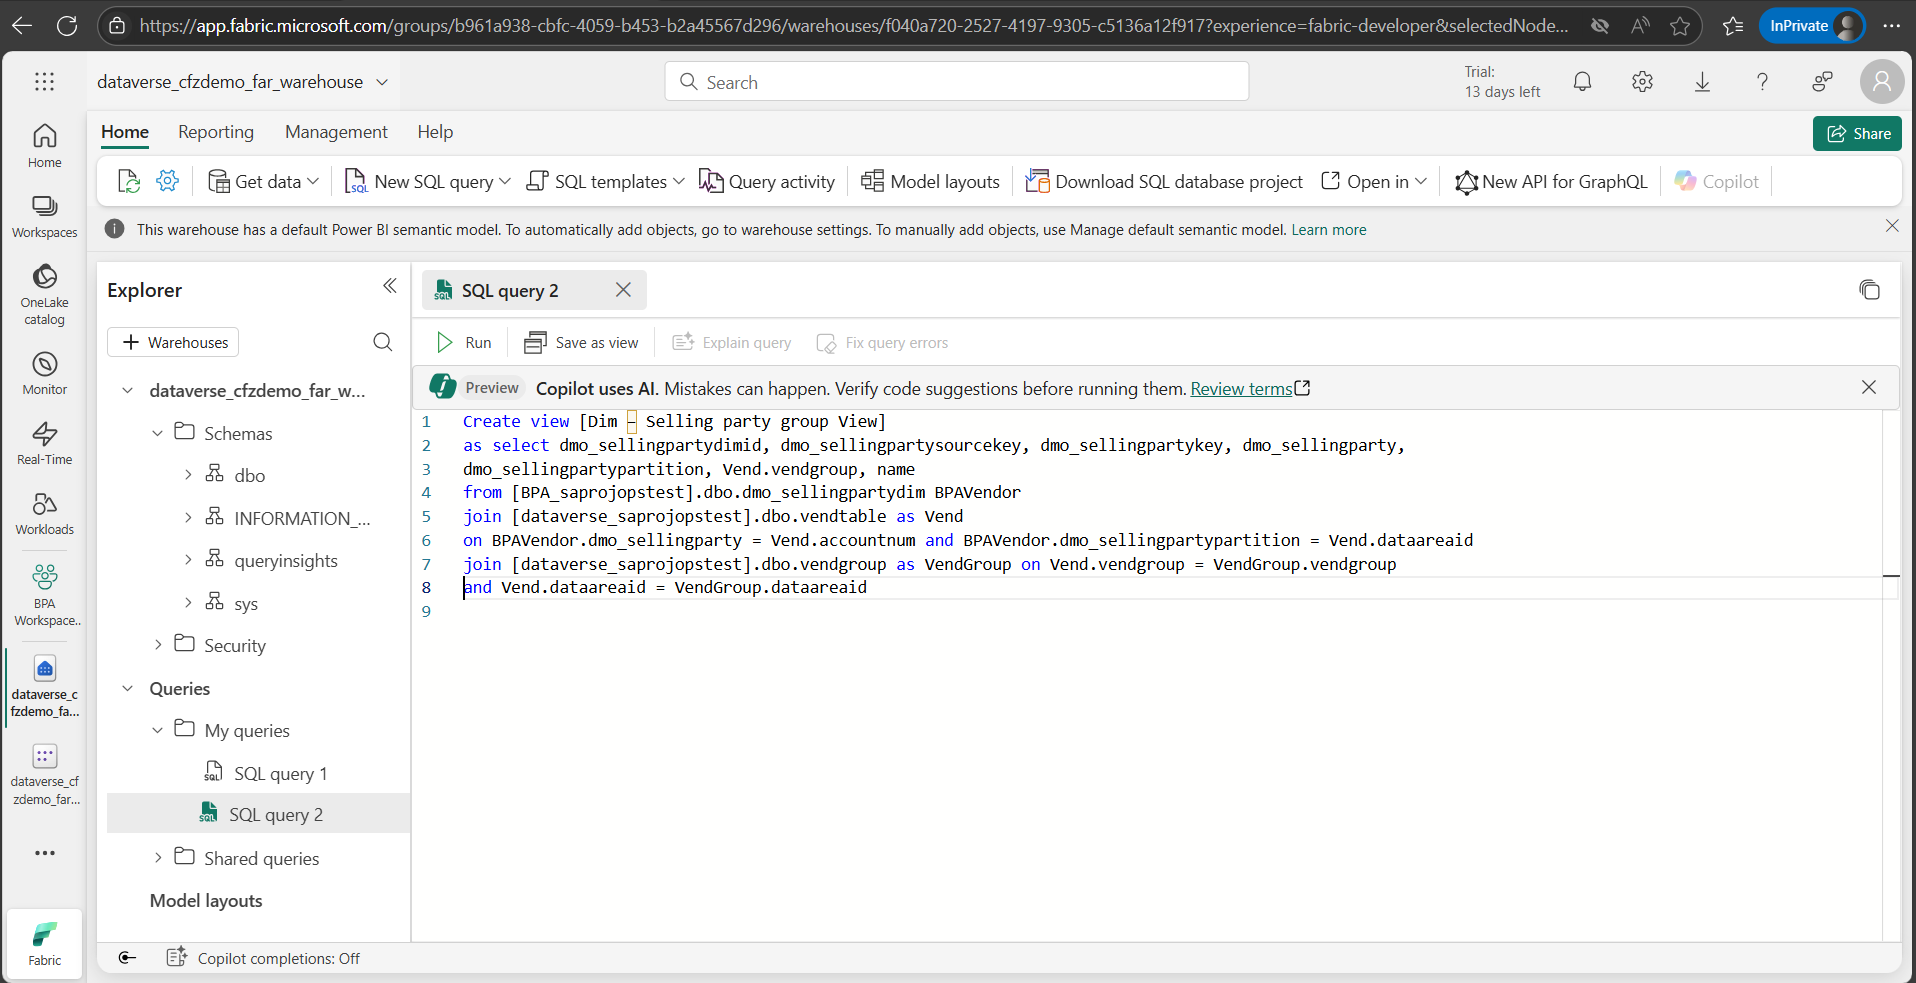
15- Create view [Dim – Selling party group View]
- as select dmo_sellingpartydimid, dmo_sellingpartysourcekey, dmo_sellingpartykey, dmo_sellingparty, dmo_sellingpartypartition, Vend.vendgroup, name from [BPA_saprojopstest].dbo.dmo_sellingpartydim BPAVendor join [dataverse_saprojopstest].dbo.vendtable as Vend on BPAVendor.dmo_sellingparty = Vend.accountnum and BPAVendor.dmo_sellingpartypartition = Vend.dataareaid join [dataverse_saprojopstest].dbo.vendgroup as VendGroup on Vend.vendgroup = VendGroup.vendgroup and Vend.dataareaid = VendGroup.dataareaid
16- Based on Lakehouse names, the above query needs to be changed to point to the correct Lakehouse on the Dataverse and BPA.
17- Click run to create a view in the environment, and once made, it will be available under views.
18- Next, we will create a table and use that to store the data in the warehouse.
Note: Only one-time data creation is completed as part of this HOL. The data will not be refreshed automatically in the new table, and users need to determine how to refresh data in the underlying table, so new / updated data from Dynamics 365 Finance is available in the view.
19- Run the query below to create a new table.
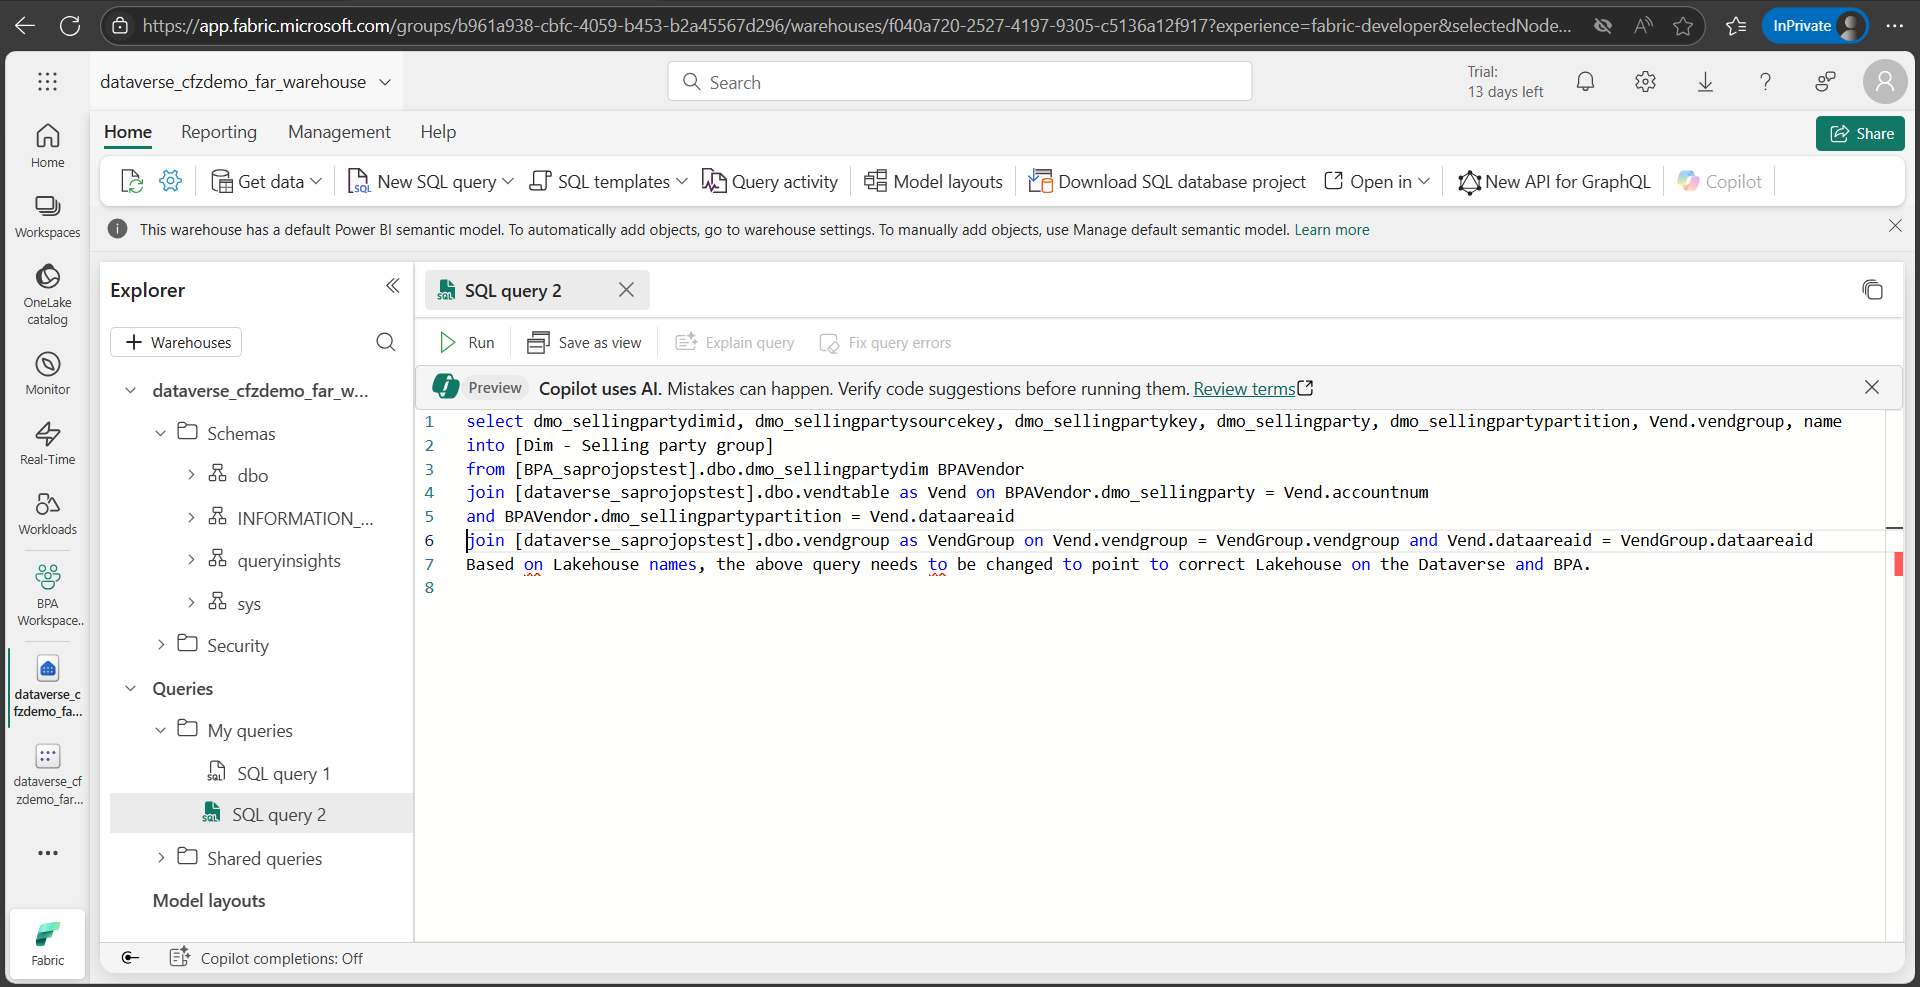
20- select dmo_sellingpartydimid, dmo_sellingpartysourcekey, dmo_sellingpartykey, dmo_sellingparty, dmo_sellingpartypartition, Vend.vendgroup, name
into [Dim – Selling party group] from [BPA_saprojopstest].dbo.dmo_sellingpartydim BPAVendor join [dataverse_saprojopstest].dbo.vendtable as Vend on BPAVendor.dmo_sellingparty = Vend.accountnum and BPAVendor.dmo_sellingpartypartition = Vend.dataareaid join [dataverse_saprojopstest].dbo.vendgroup as VendGroup on Vend.vendgroup = VendGroup.vendgroup and Vend.dataareaid = VendGroup.dataareaid
21- Based on Lakehouse names, the above query needs to be changed to point to the correct Lakehouse on the Dataverse and BPA.
Step 7: Download the BPA dataset (.pbix) for the Vendor transaction details report
1- Sign in to the BPA application and navigate to Reports.
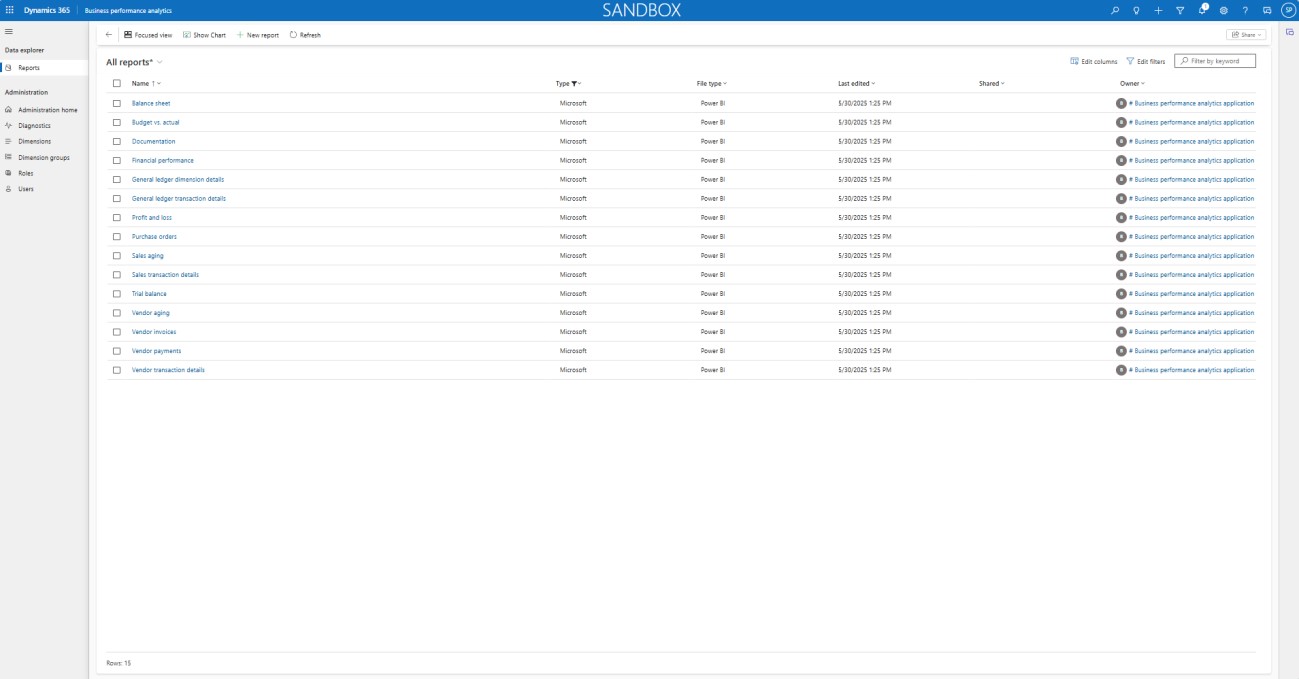
2- Click on the Vendor transactions details report.

3- The report displays the data. This helps ensure that our report is functioning properly.
4- Next, we will download the .pbix file for the report.
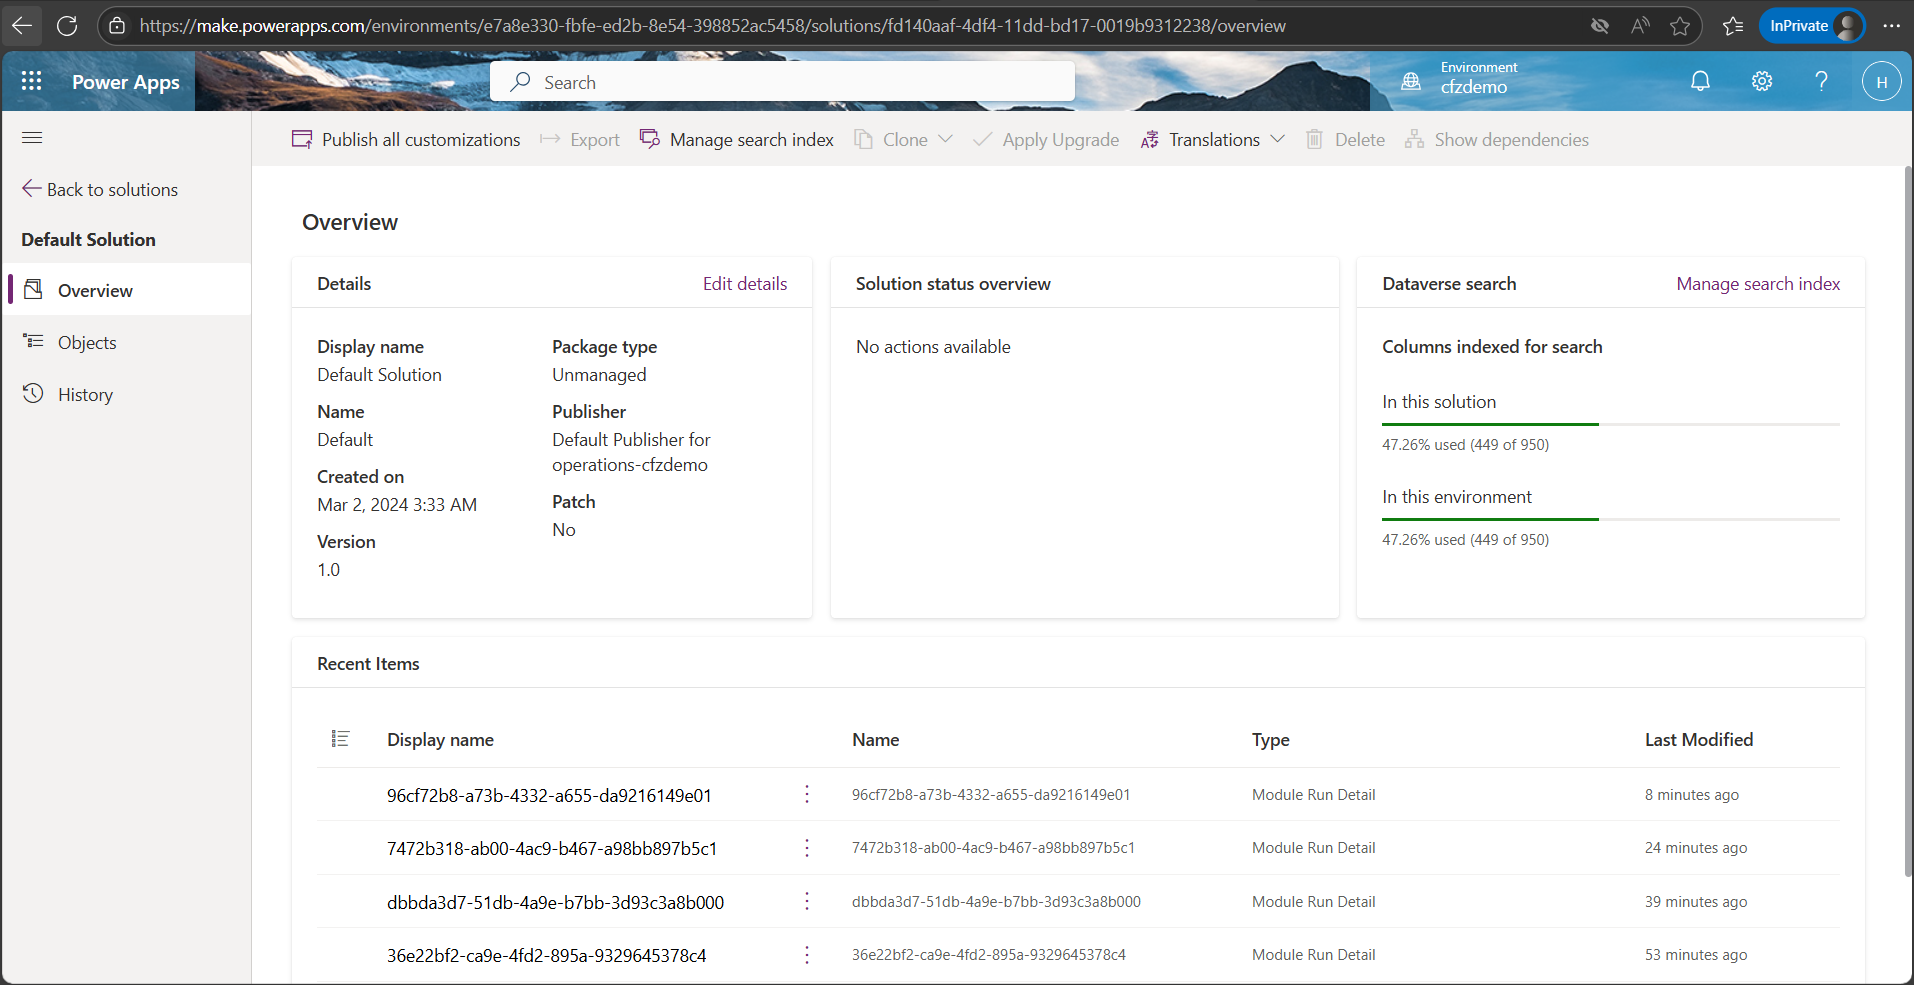
5- To download the .pbix file, sign in to Power Apps | Home and select the correct environment in the top right corner. 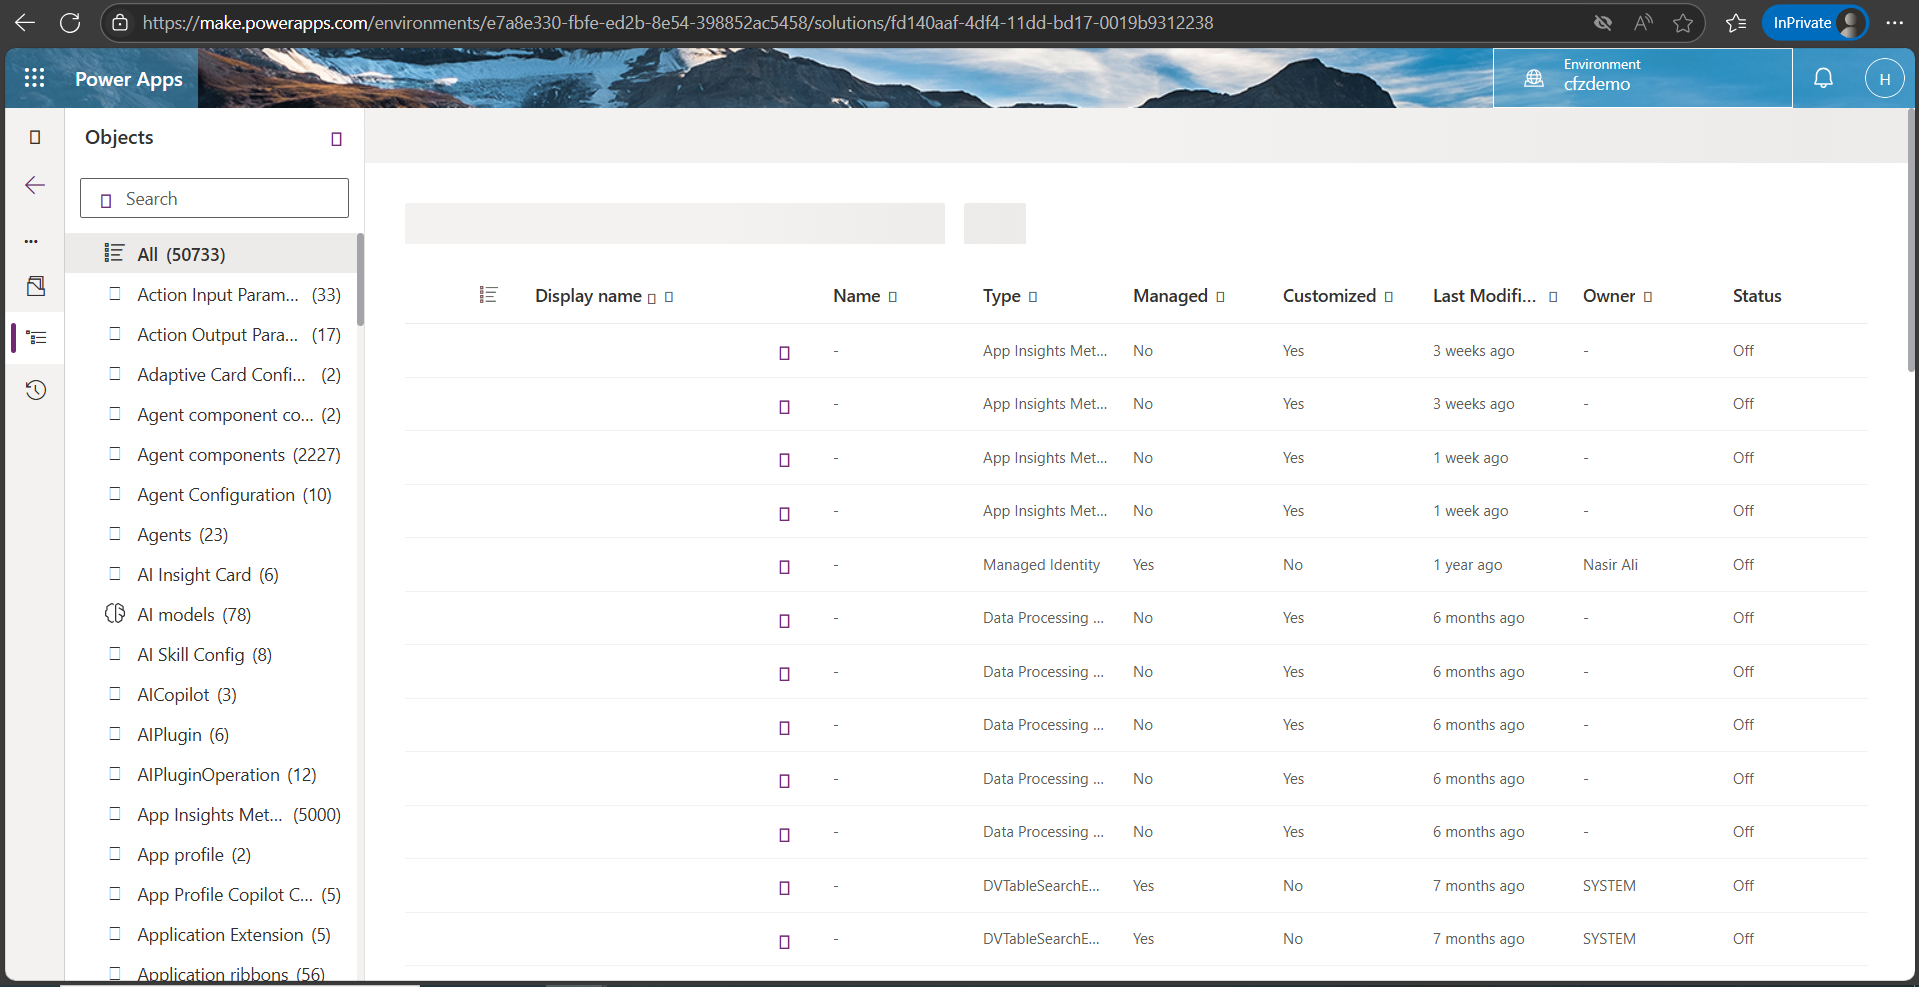
6- Click on Solutions in the left pane.
7- On the Solutions page, click on Default solution. 
8- Search for vendor transaction details. 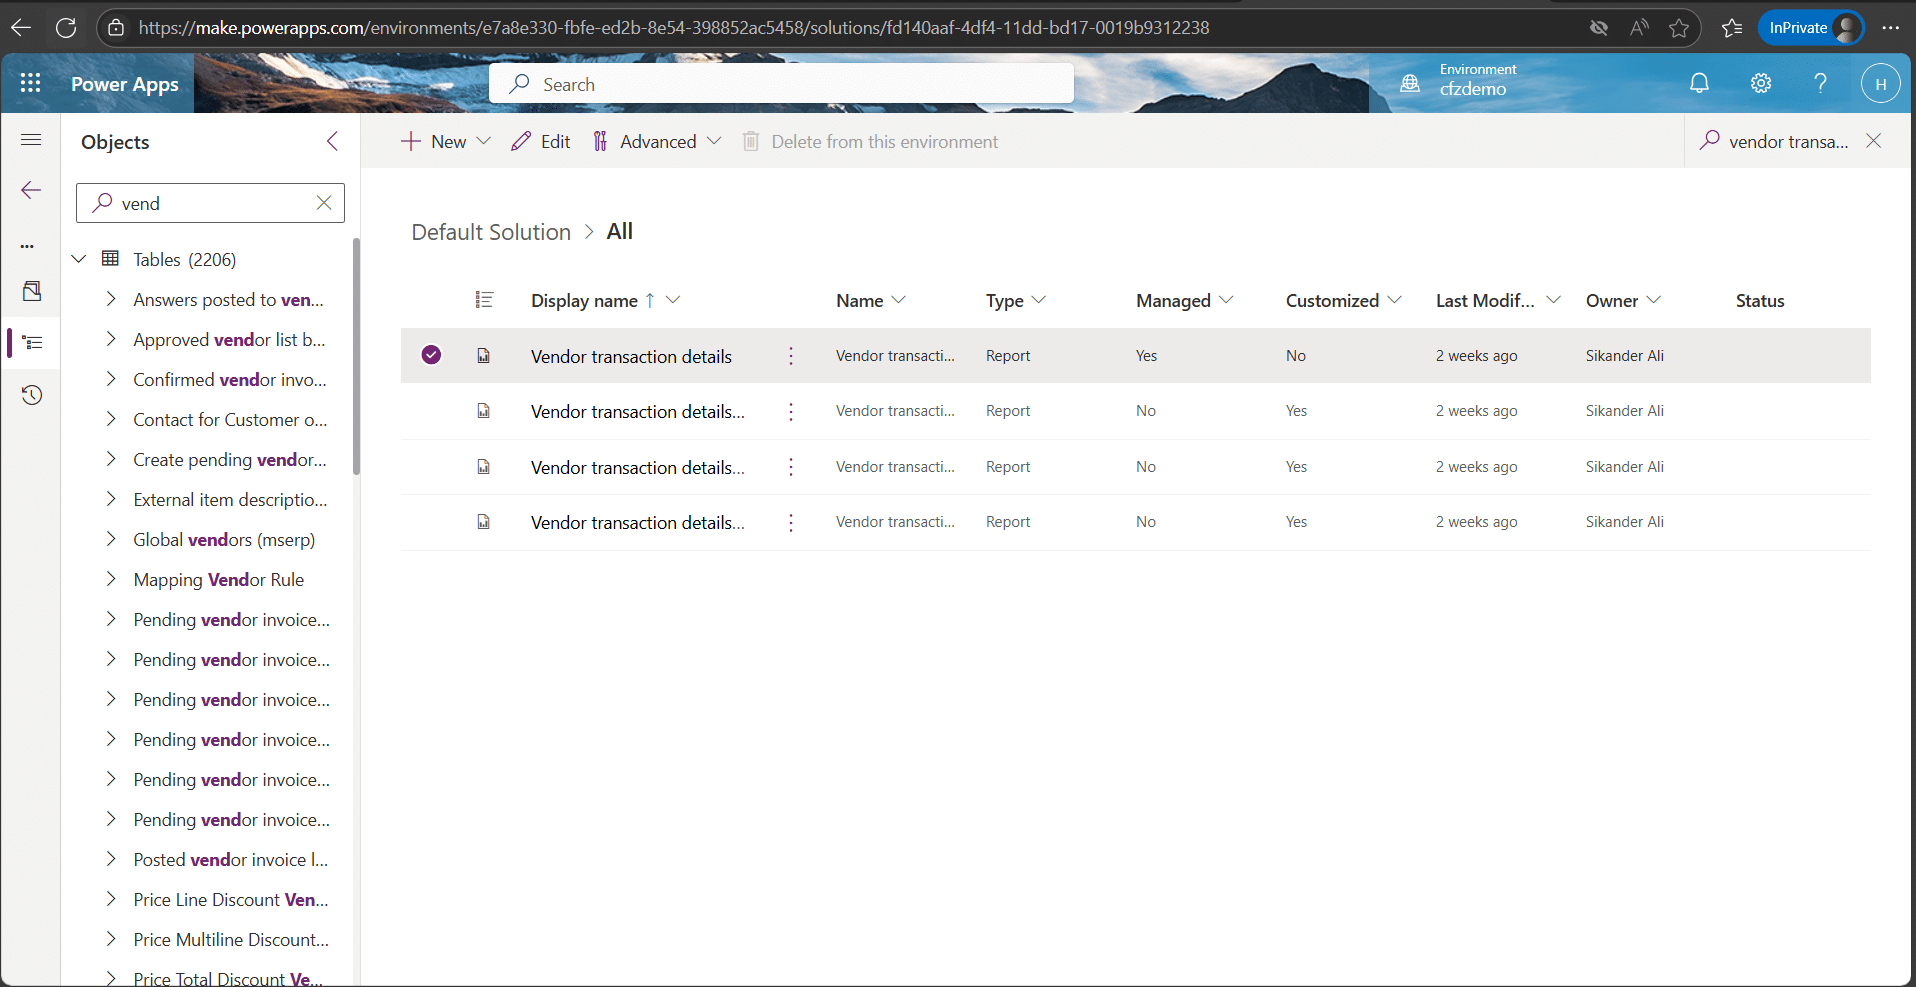
9- Click on Vendor transaction details to view details of the report.
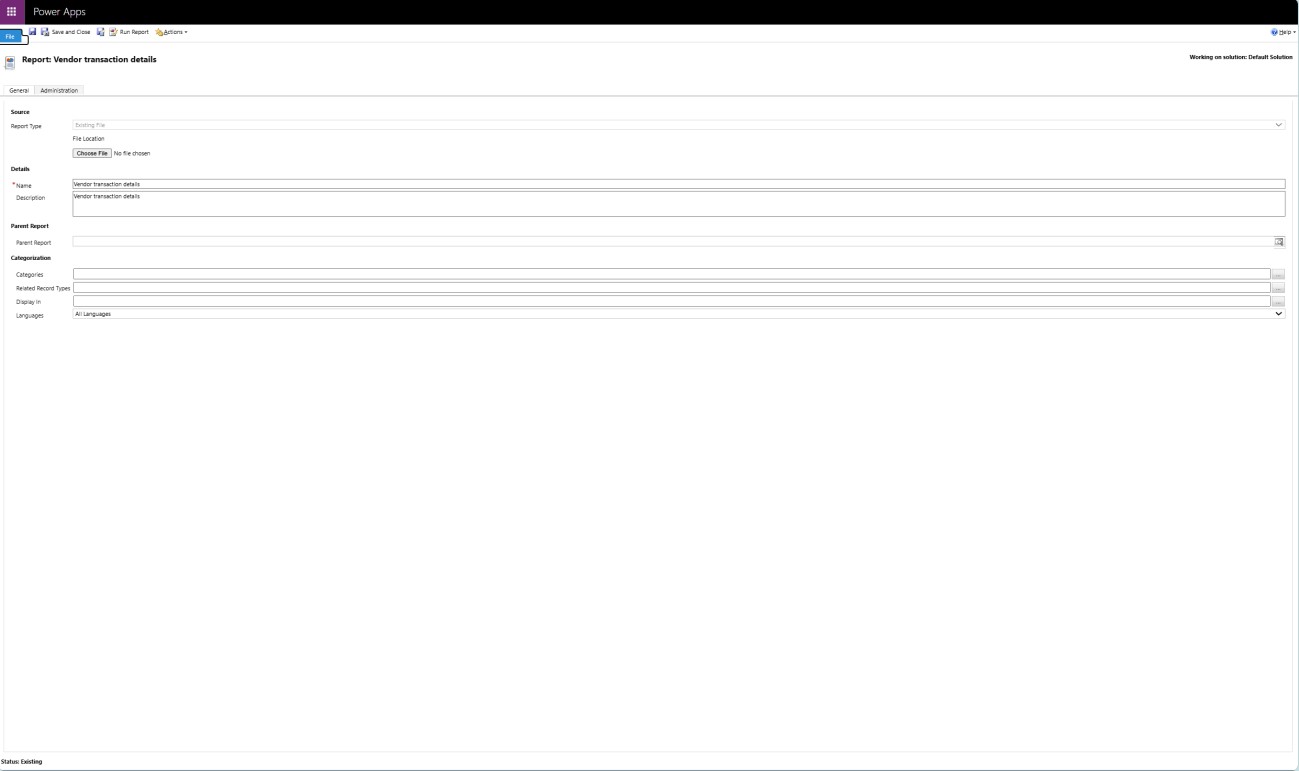
10- Click on actions > download report.
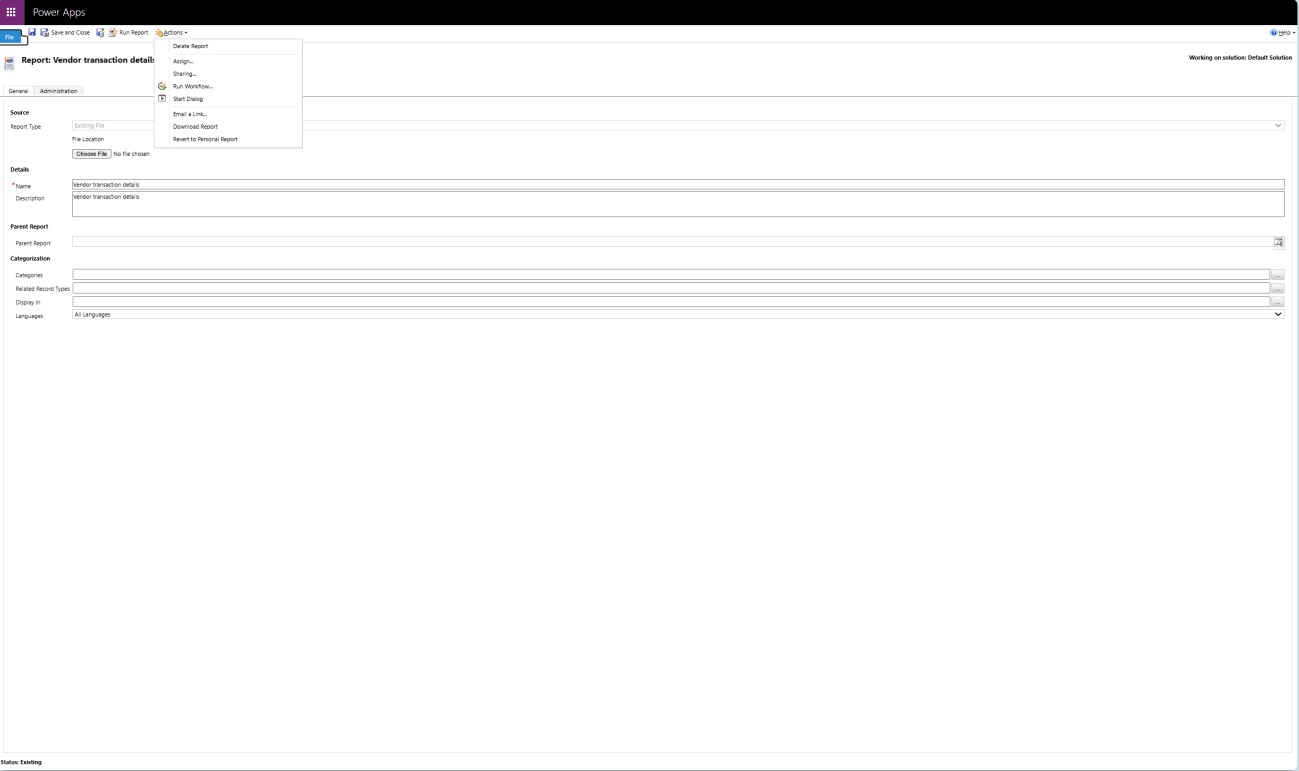
11- This will download the .pbix file for the vendor transaction details report.
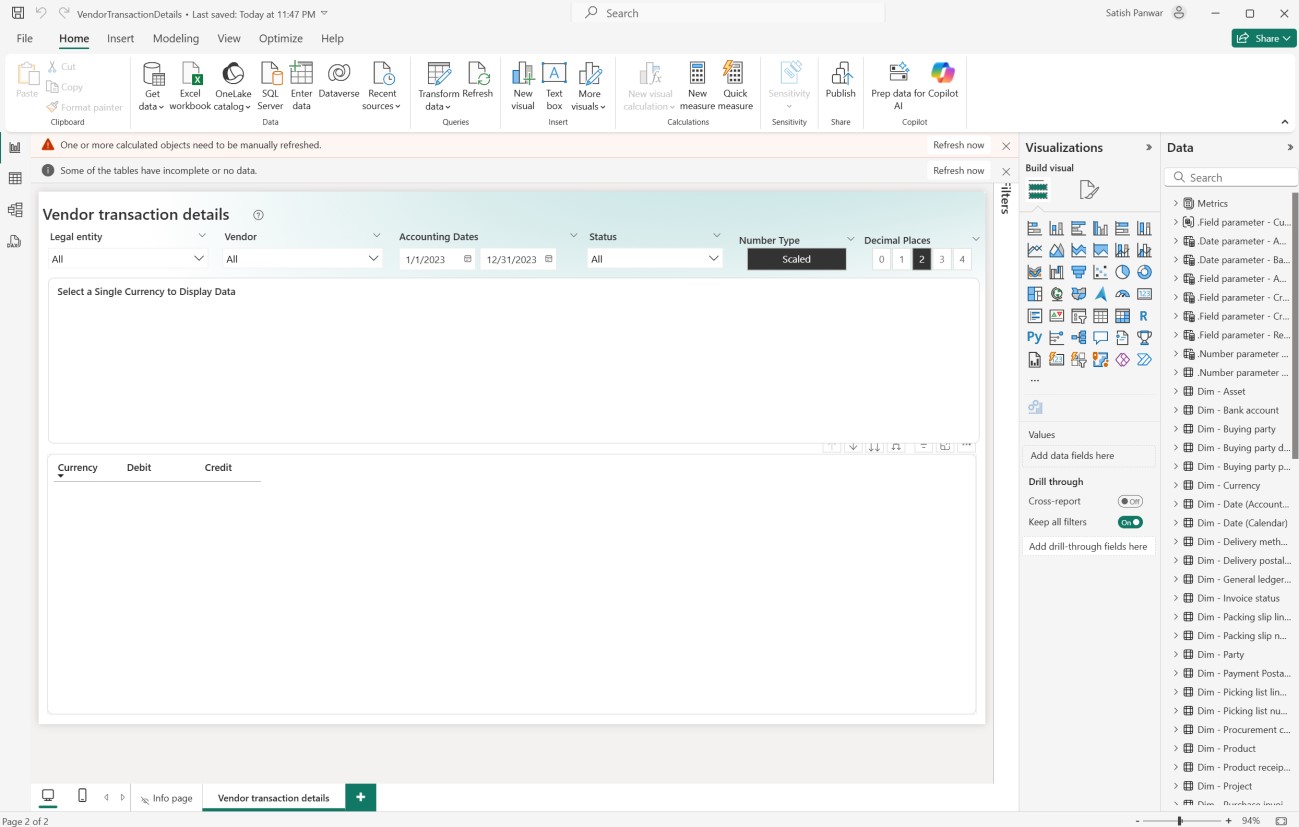
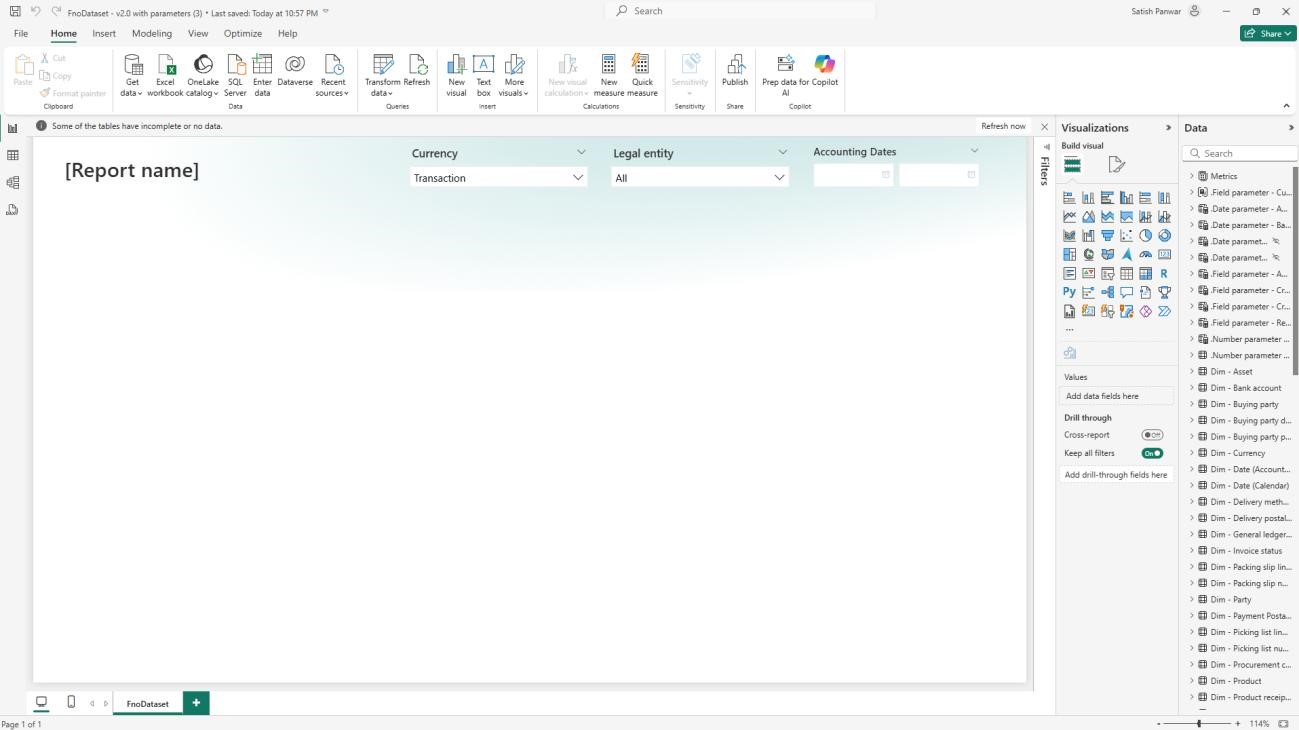
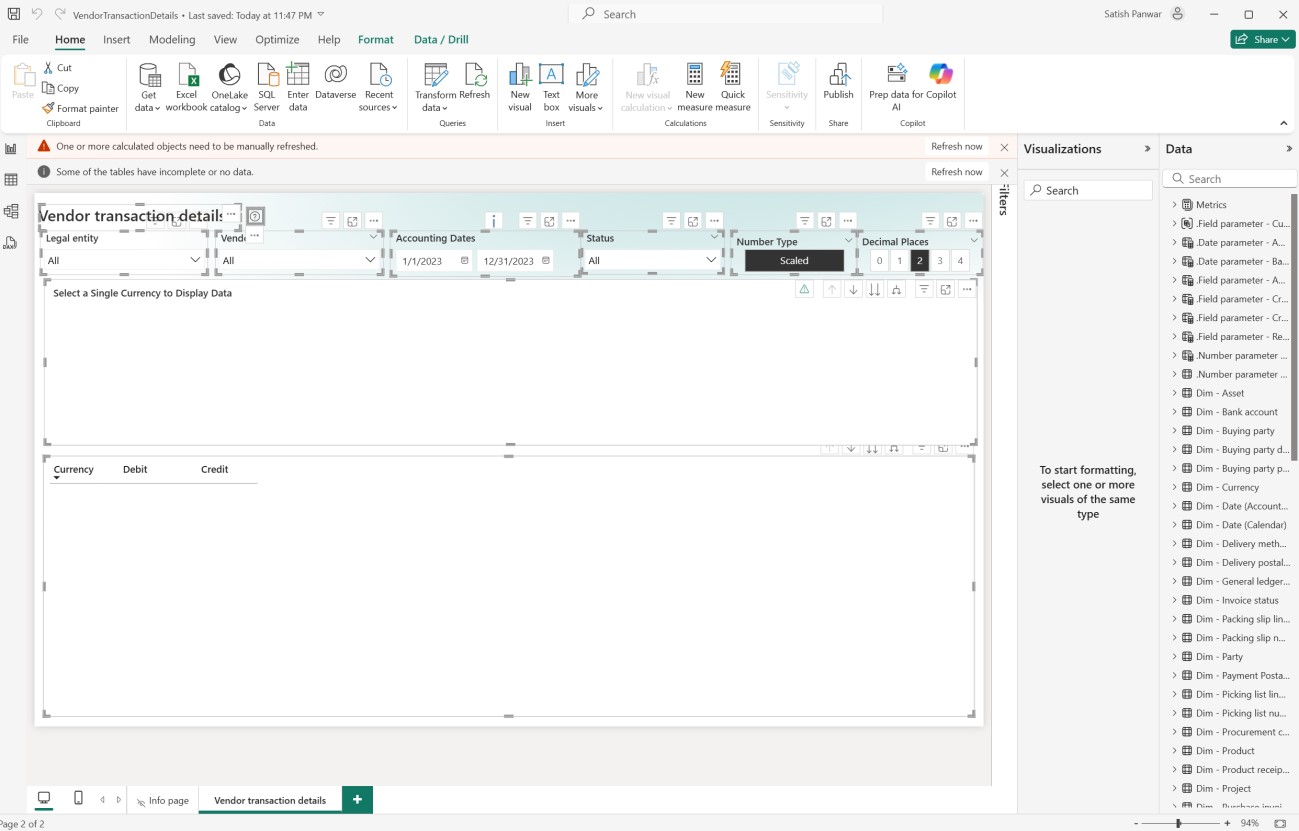
12- Launch the POWER BI app and open the .pbix file.
13- The report looks like the one in the screenshot below.
14- Note that data will not be displayed. The .pbix file is not parameterized and can’t be directly connected to the Fabric workspace.
Step 8: Request for BPA dataset (pbix) from Microsoft
1- To obtain the Business performance analytics dataset (pbix) from Microsoft, create a support ticket through your standard Microsoft support channel.
2- In the ticket, request a secure download link for the BPA .pbix file.
3- Once approved, you receive a secured link to download the file. The file is currently named FnoDataset – v2.0 with parameters.pbix.
4- Download the file and save it on your workstation.
Step 9: Gather dataset parameters from Fabric
1- Sign in to Fabric
2- Go to workspaces and select your workspace.
3- The Lakehouse within the workspace will be displayed. 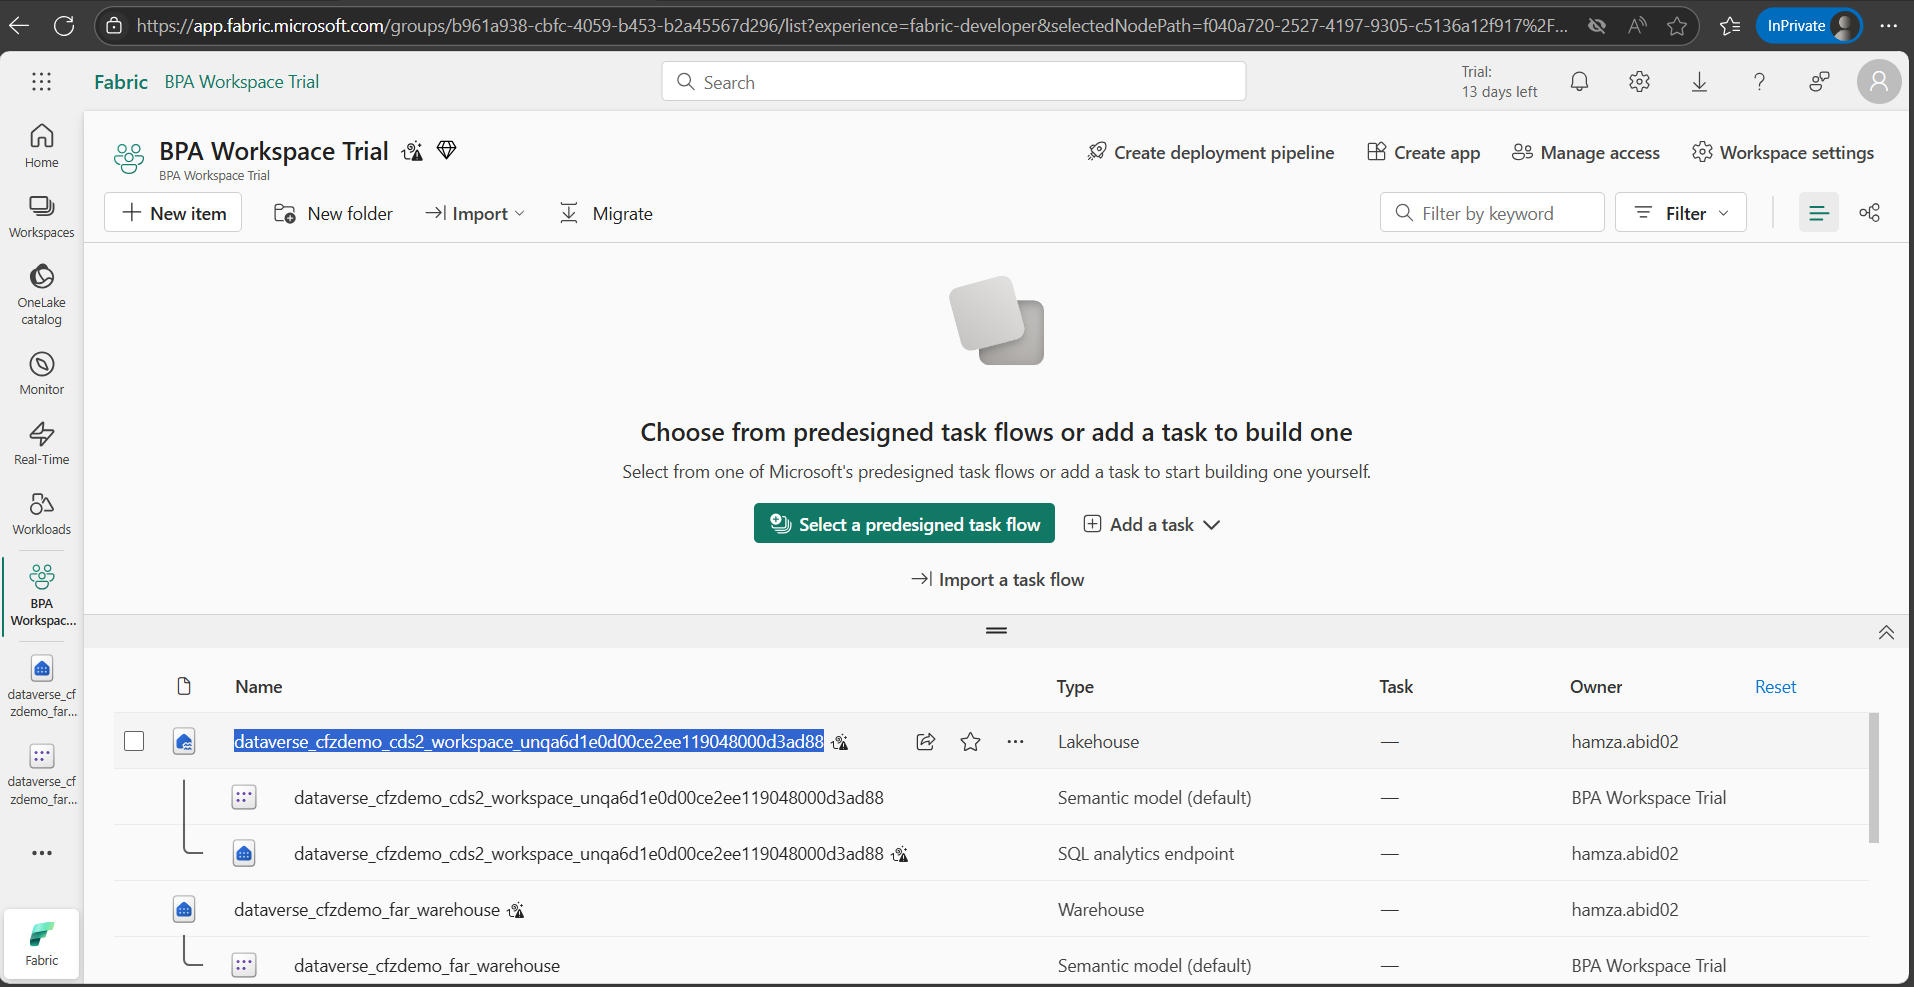
4- Select BPA Lakehouse and click on … > Settings. 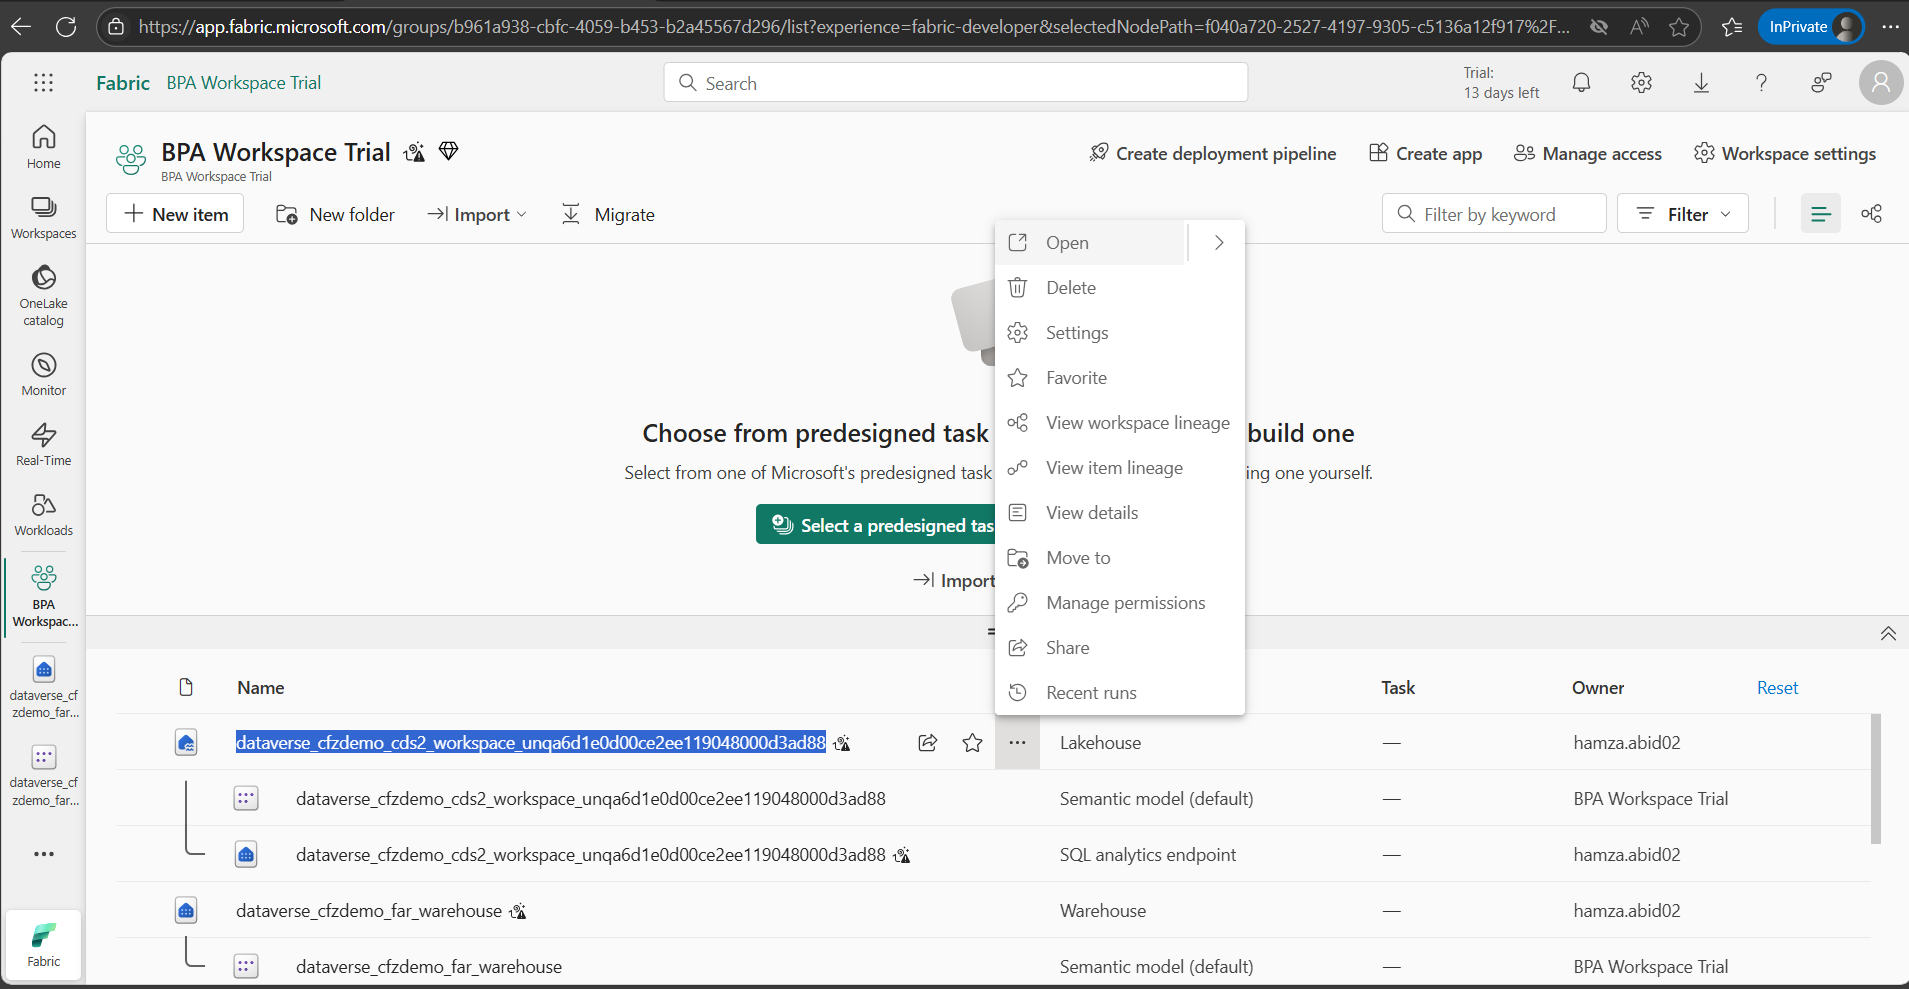
5- Click on SQL analytics endpoint.
6- Copy the connection string using the clipboard to sign and store the value in a notepad. 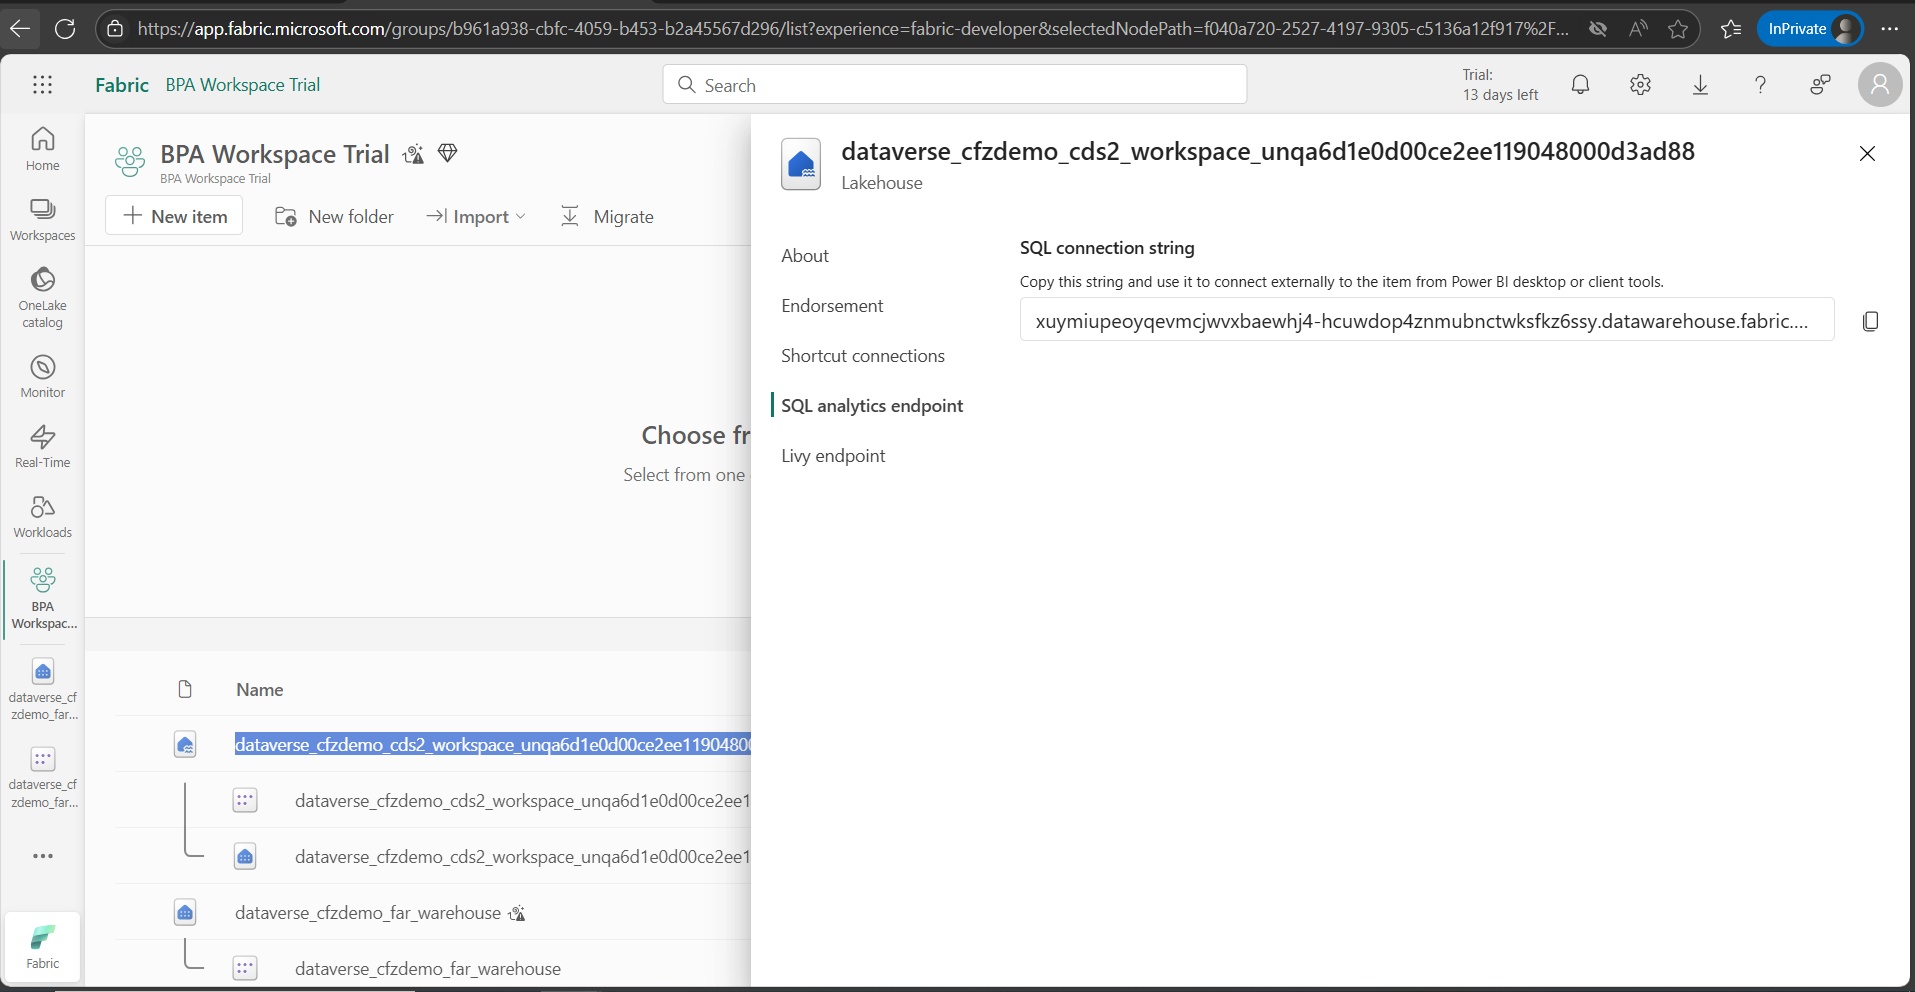
7- Click on the BPA Lakehouse name and copy the value. Store the value in a notepad.
Step 10: Open the dataset in Power BI Desktop
1- Launch Power BI Desktop.
2- Open the downloaded .pbix file received from Microsoft.
3- Go to Home > Transform data > Edit parameters.
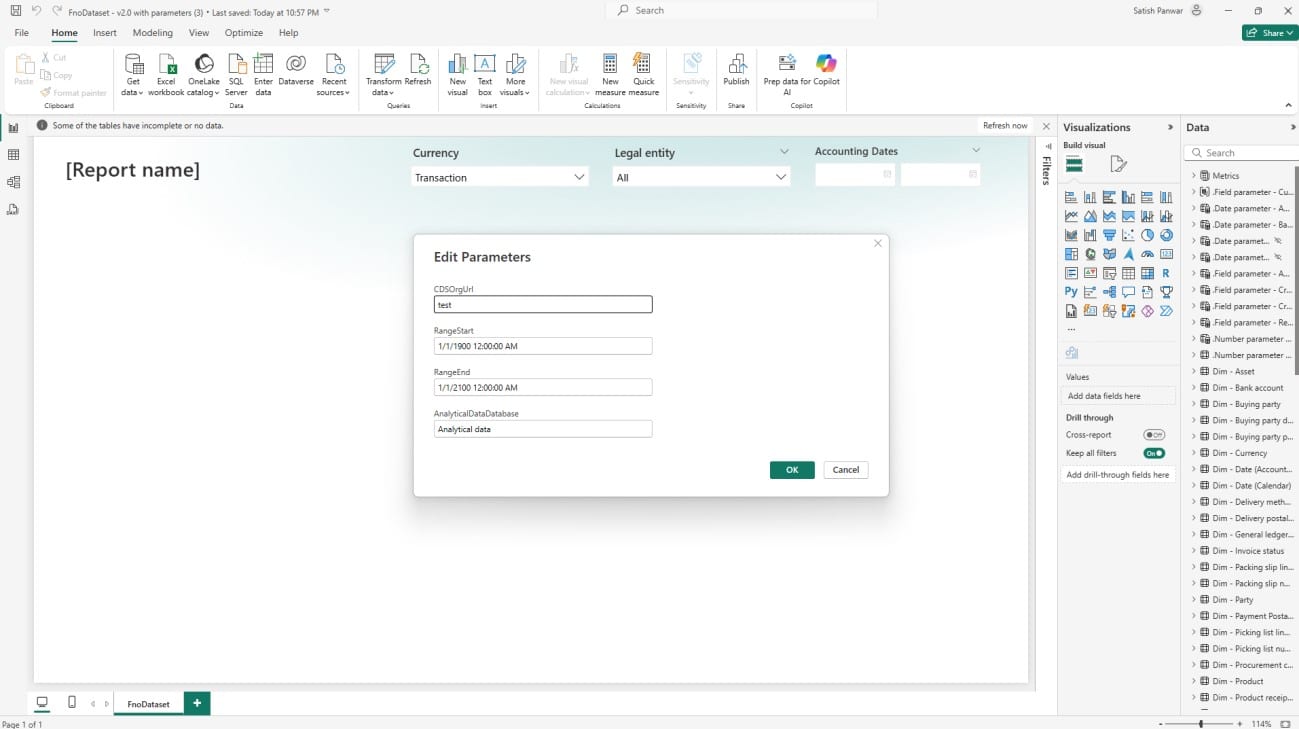
4- Update the following parameters:
- CdsOrgUrl → Paste the SQL Analytics Endpoint connection string from your Fabric Lakehouse.
- AnalyticalDataDatabase → Enter the name of your Lakehouse copied in the previous step.
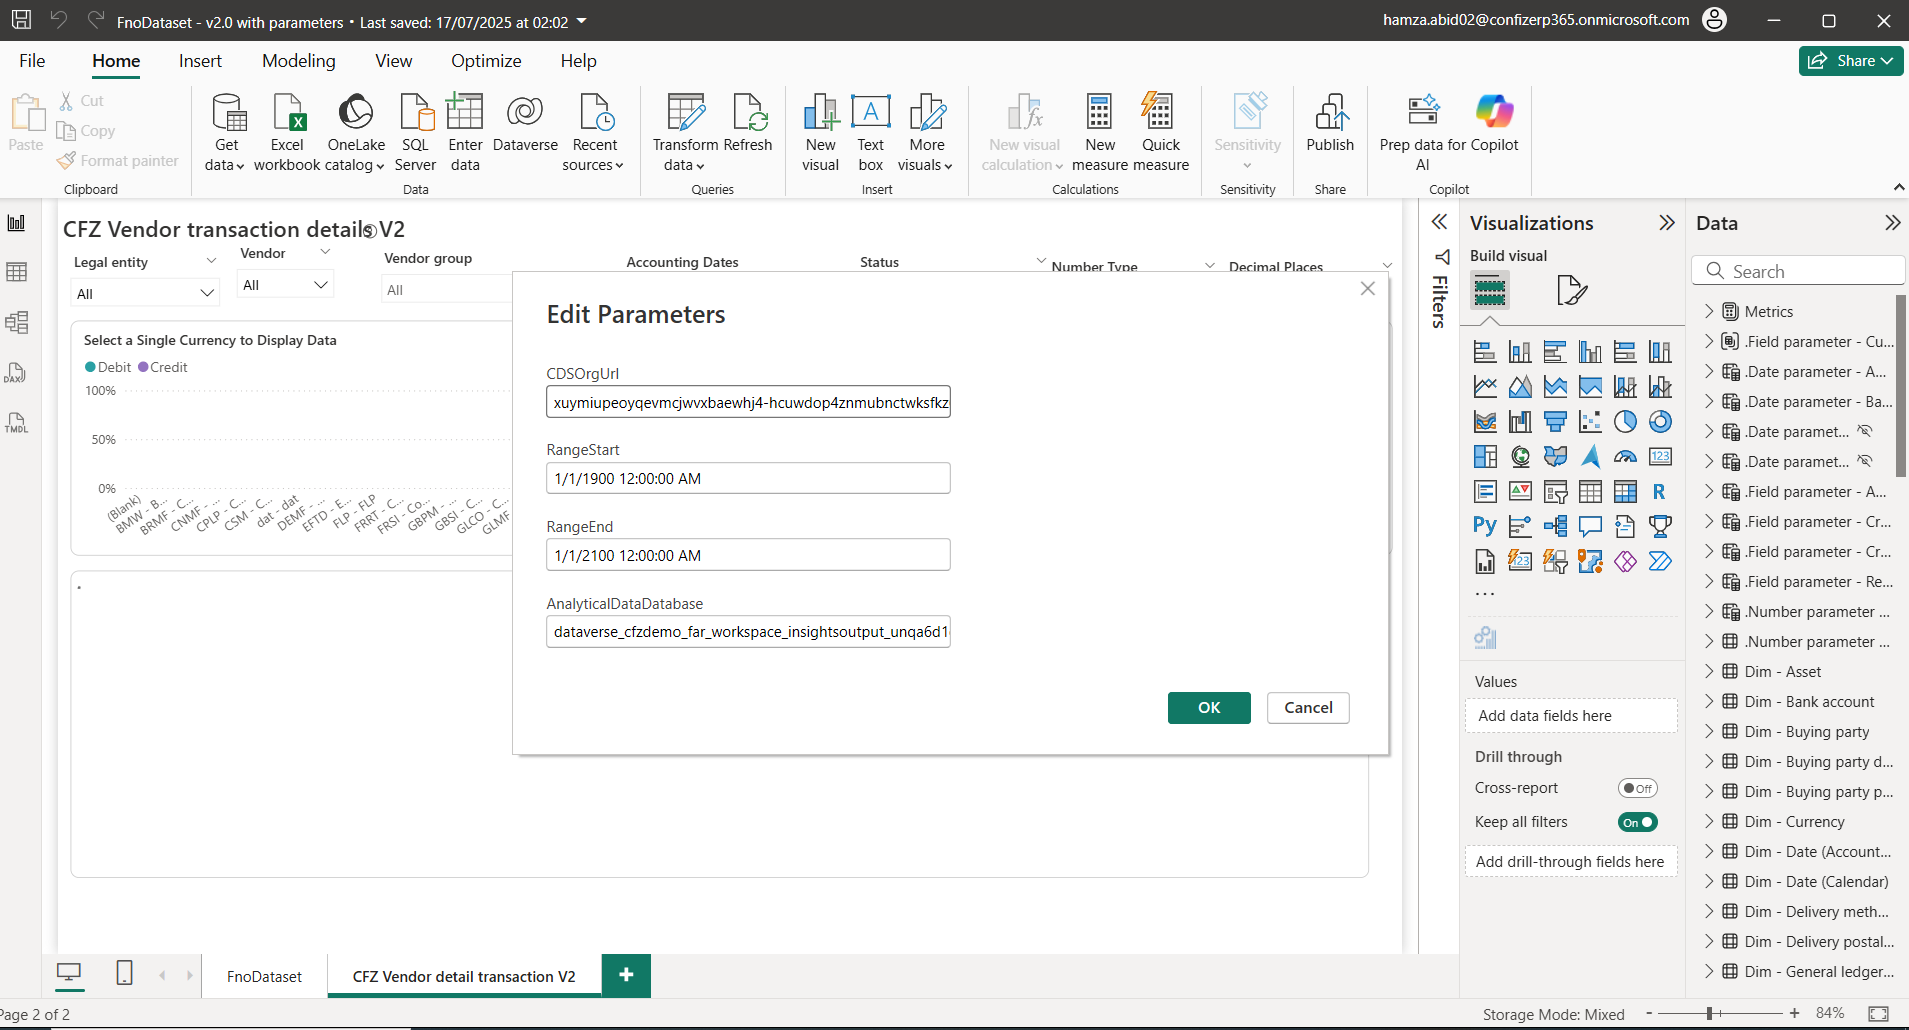
5- Click OK,
6- Click “Apply changes” to confirm the changes.
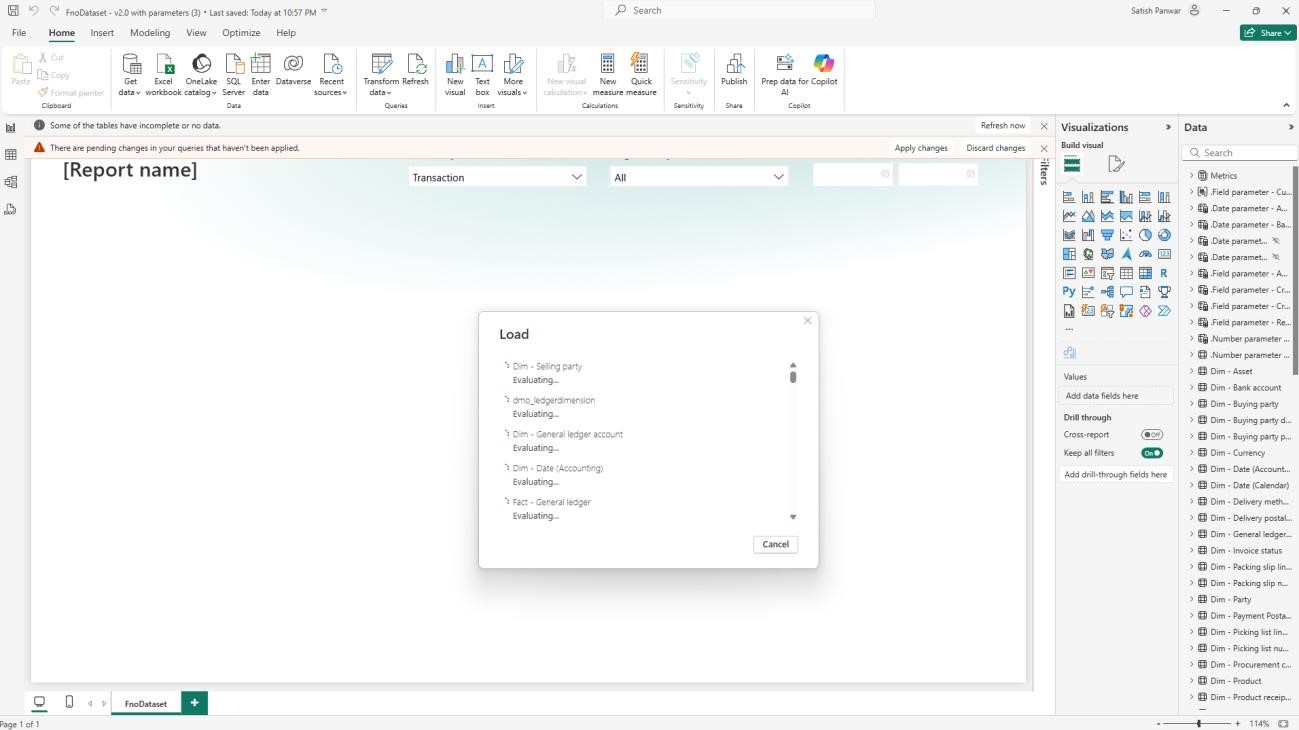
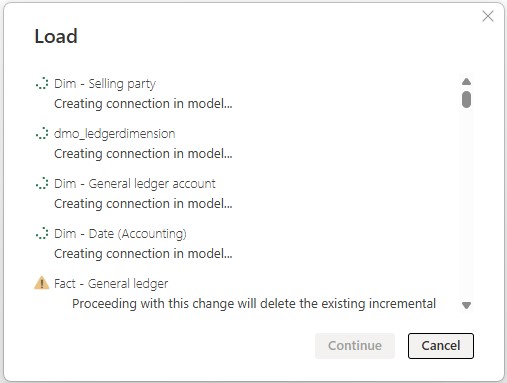
7- Click continue
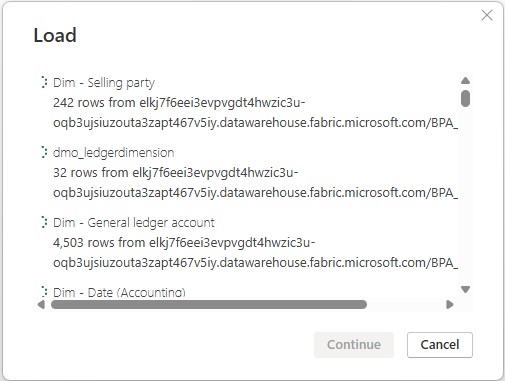
8- The dialog box will close once the data load is completed.
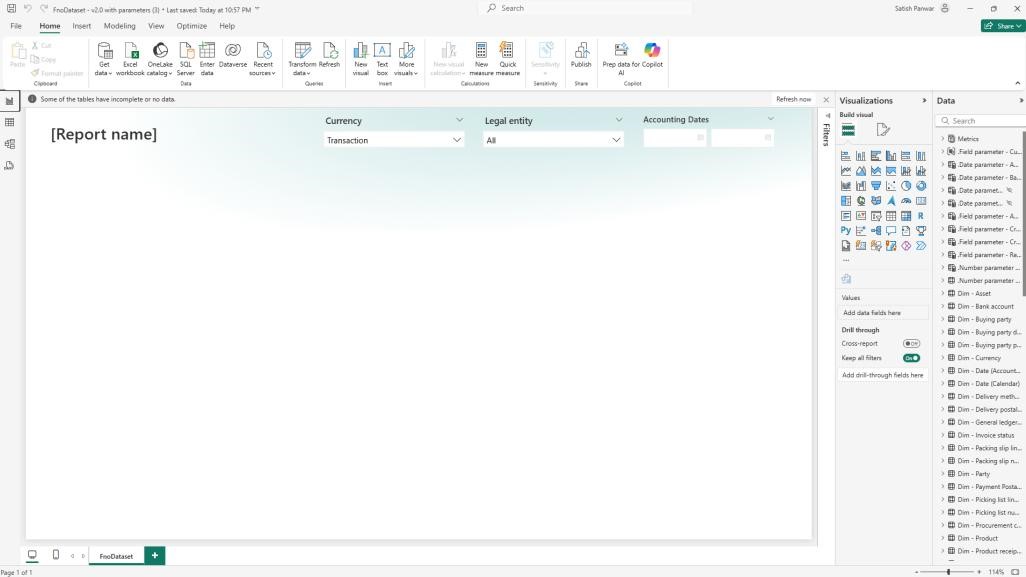
9- To validate that data has been loaded successfully. Click on tables in the left pane. Select Dim – Selling party on the right-hand side under Data.
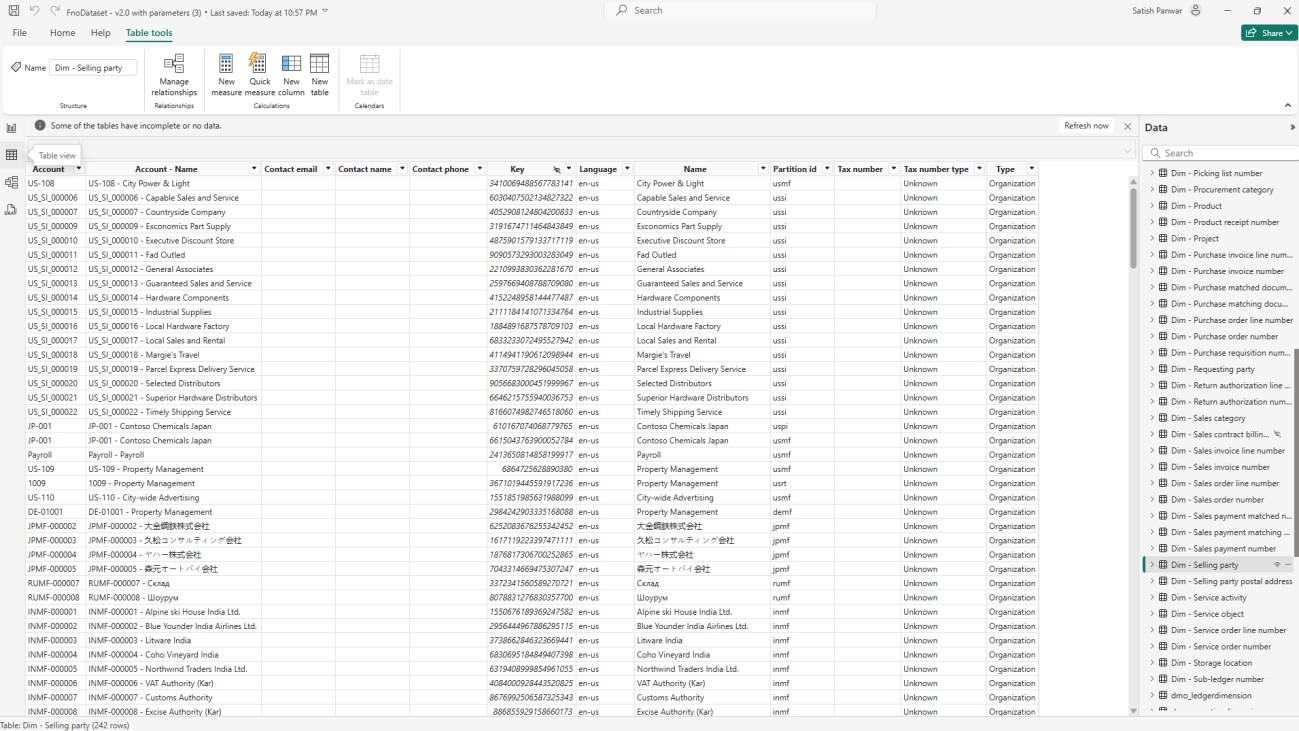
10- If data is visible, it means data loading has been completed successfully.
11- If the message is displayed on top, then click on “Refresh now” to refresh the remaining table.
Accelerate growth at an unprecedented pace
Discover how Confiz can help you take control of your daily operations, increasing growth and revenue.
Book a Free ConsultationStep 11: Copy report design to the FnODataset.pbix file
1- Go to the vendor transactions details.pbix file that was downloaded in the previous step.
2- Click Ctrl + A to select all components of the report.
3- Click Ctrl + C to copy all components.
4- Go to the FnODataSet.pbix file that was downloaded and connected to Fabric workspace in the previous step.
5- Click on + sign at the bottom of the page to create a new page.
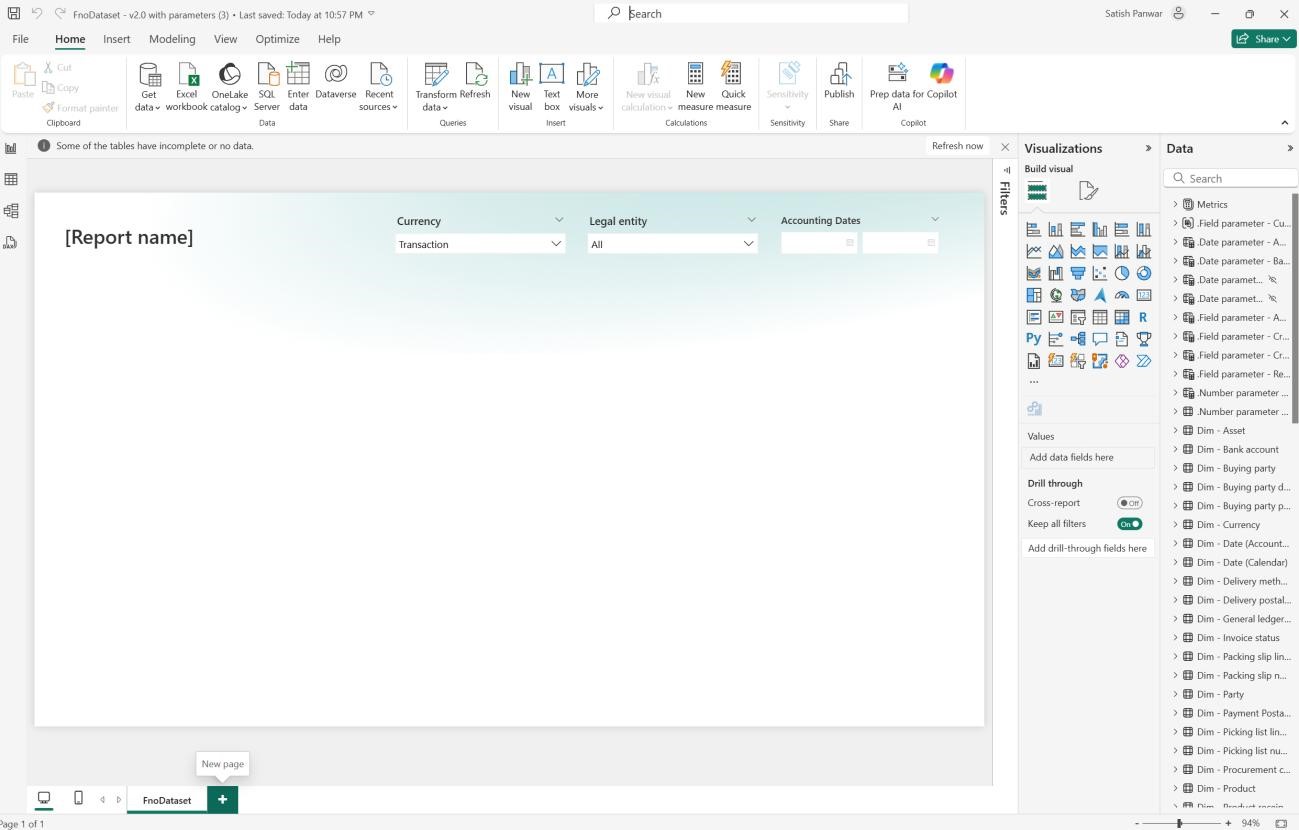
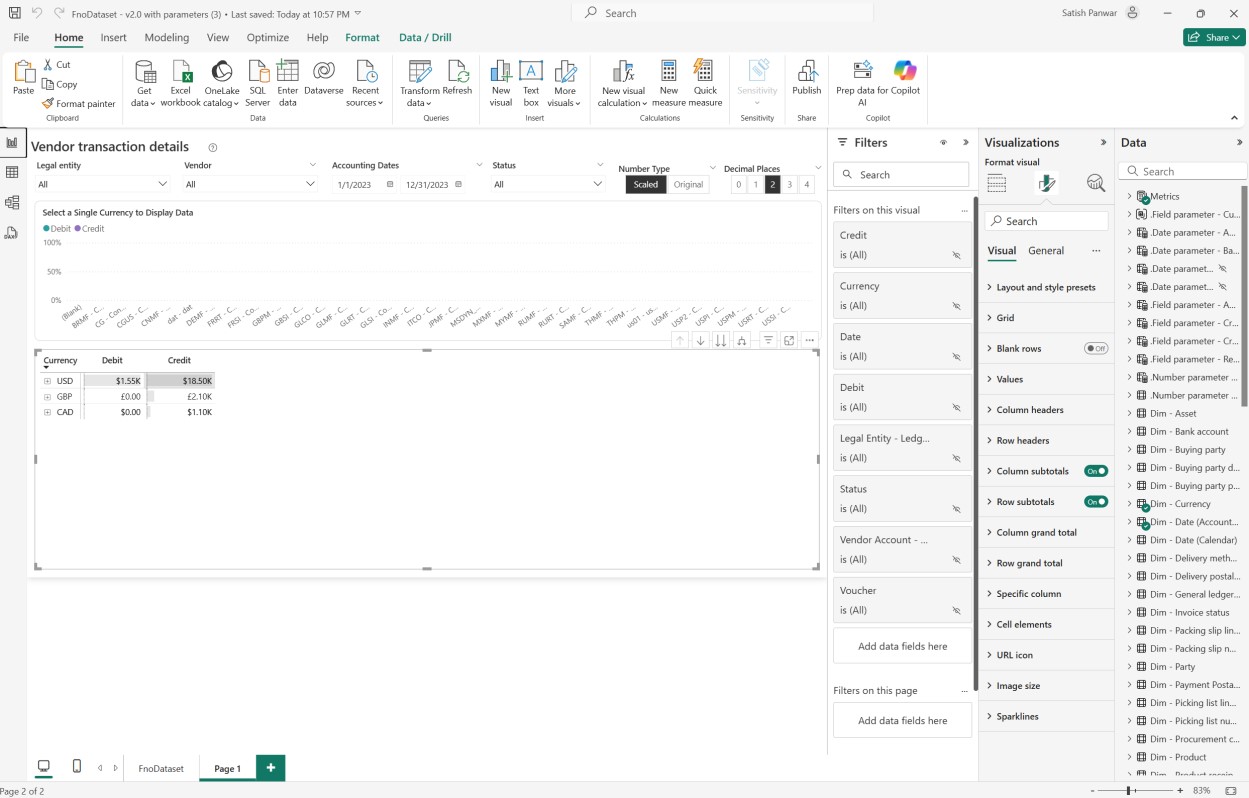
6- Press Ctrl + V to paste all report components on page 1. The data will be displayed as the dataset has already been connected to Fabric workspace.
Step 12: Connect the warehouse to the FnoDataset.pbix file
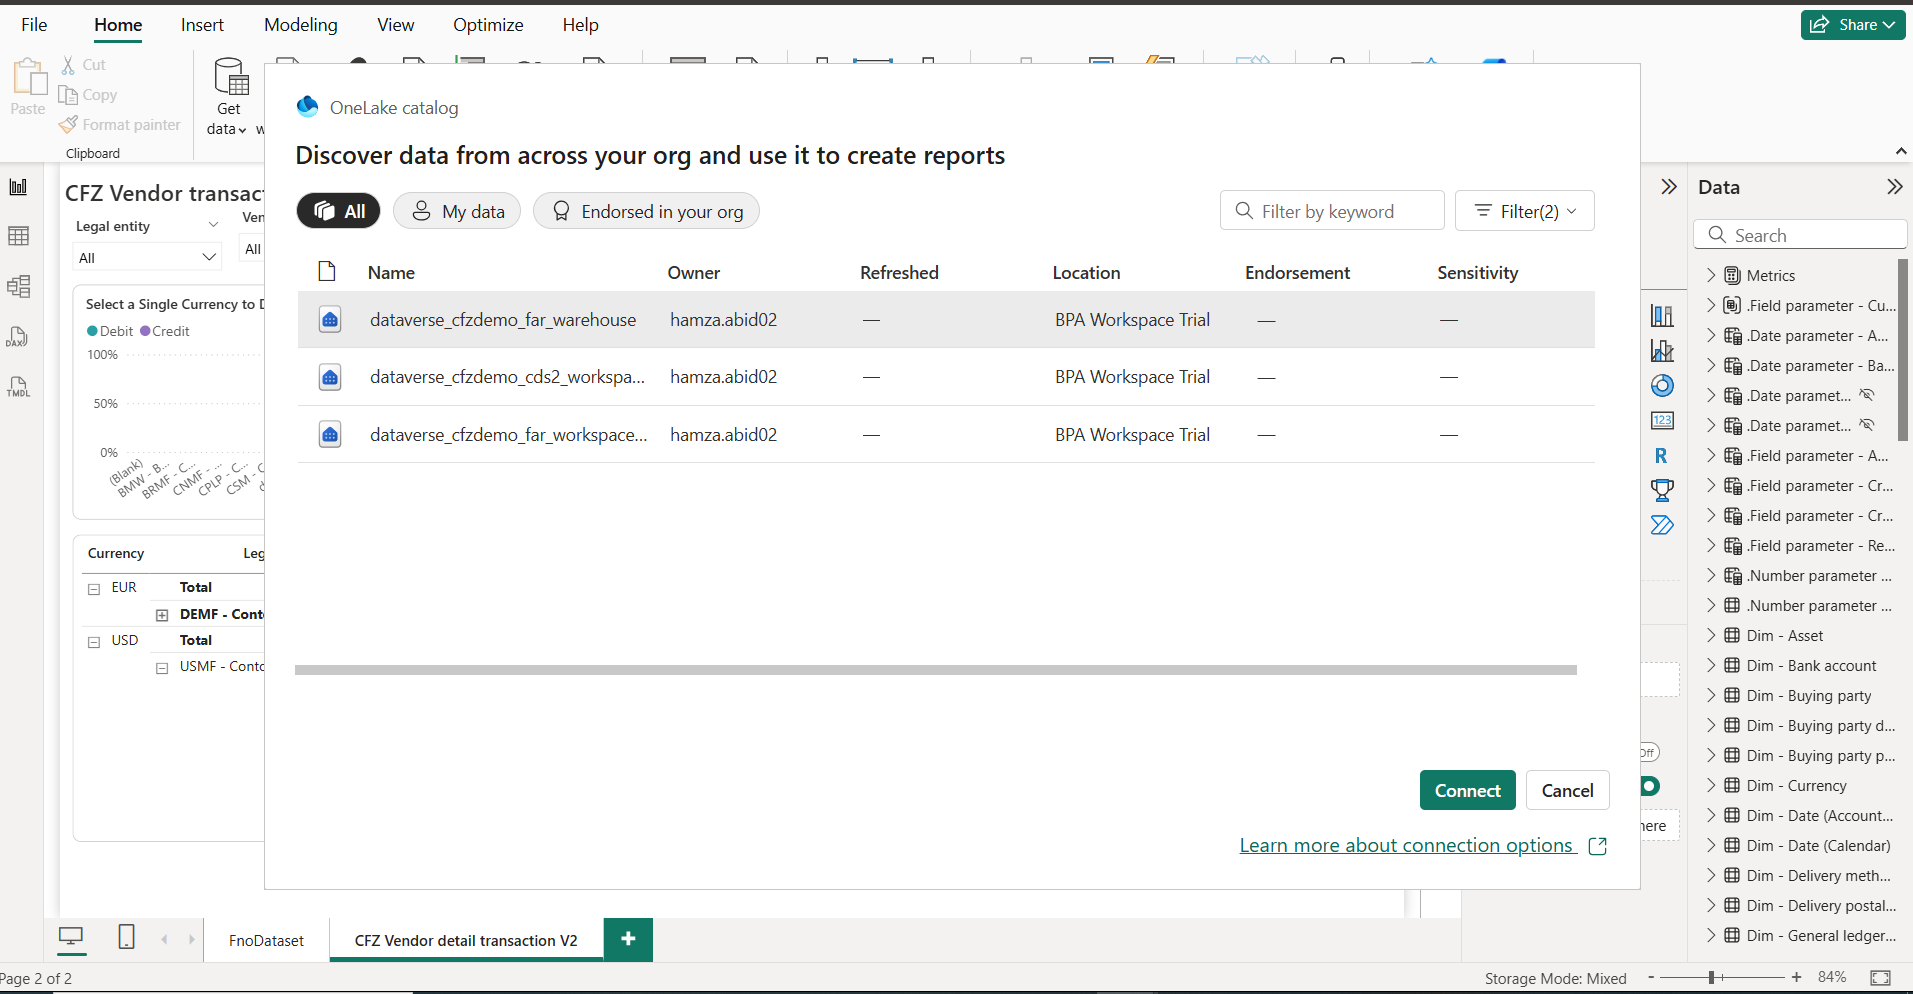
1- In Fabric, click on OneLake catalog > Warehouses.
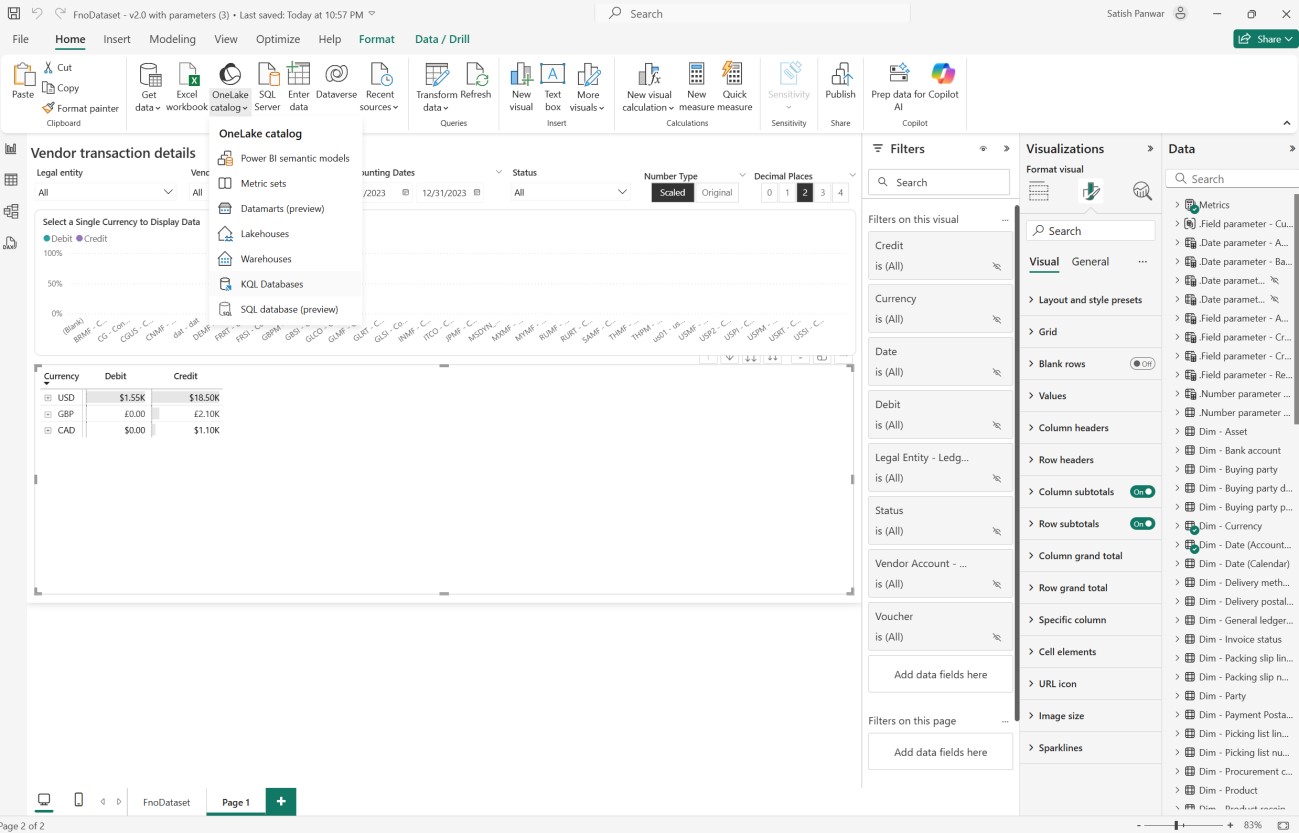
2- The warehouse created in the previous steps will be displayed.
3- Select the warehouse and click connect.
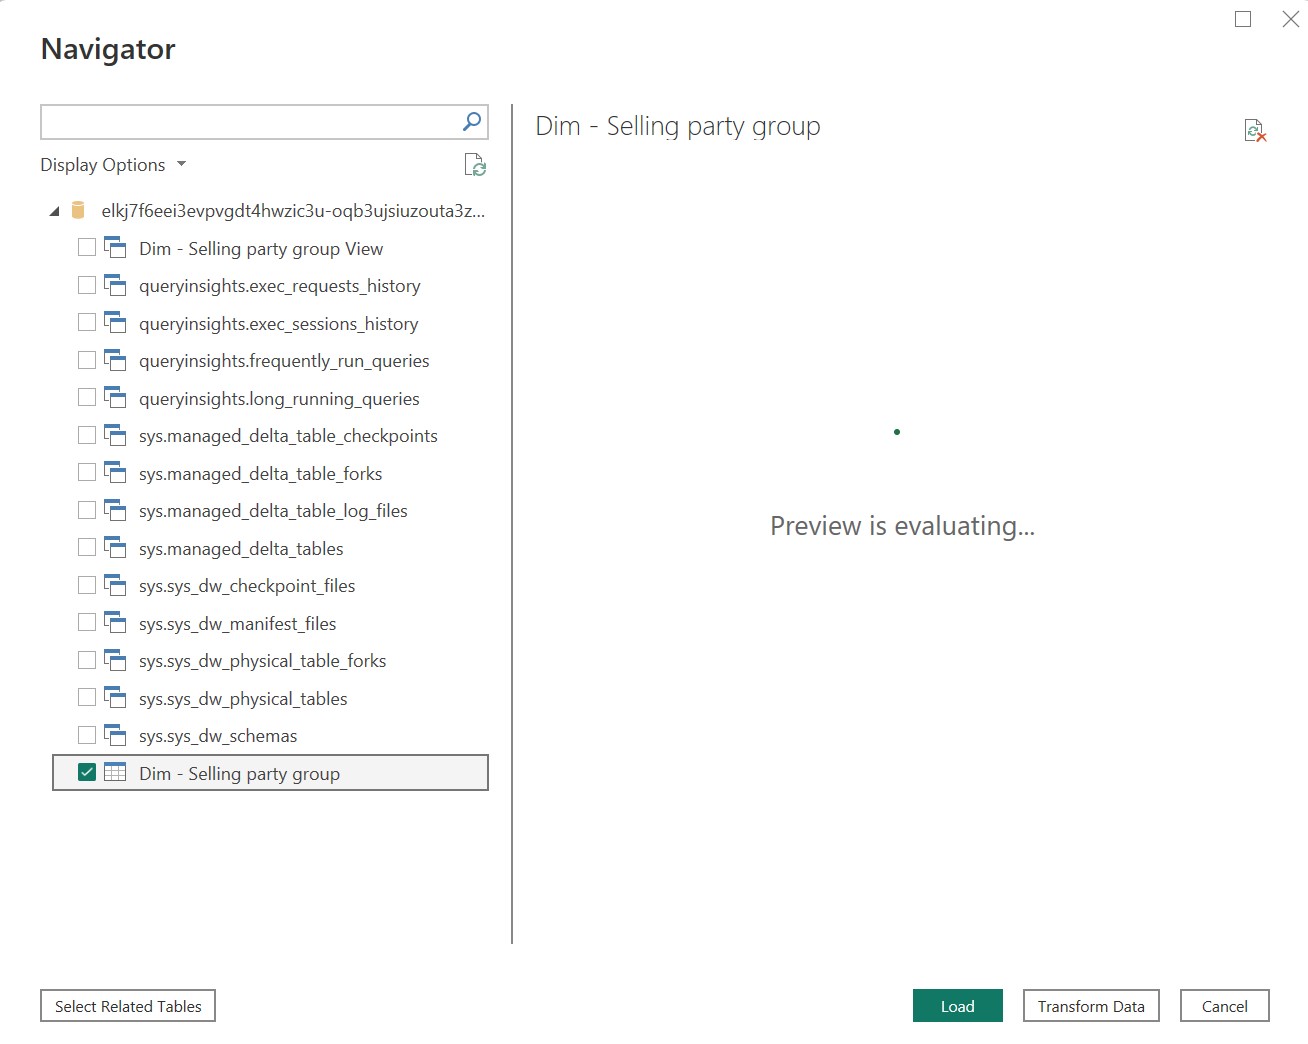
4- Select the table and click Load.
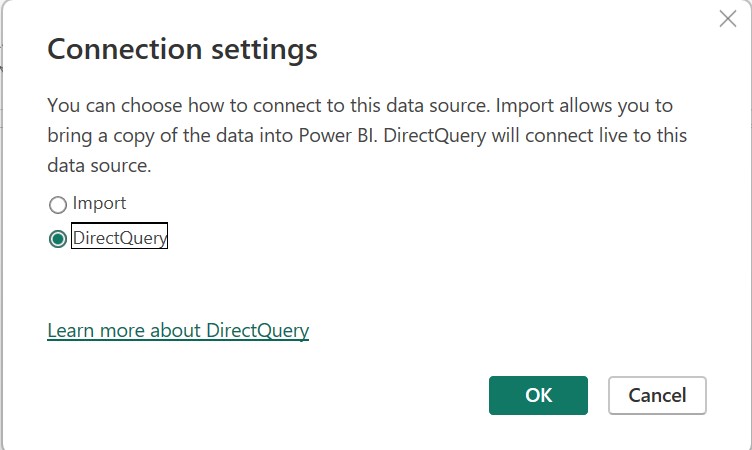
5- Select DirectQuery and click ok.
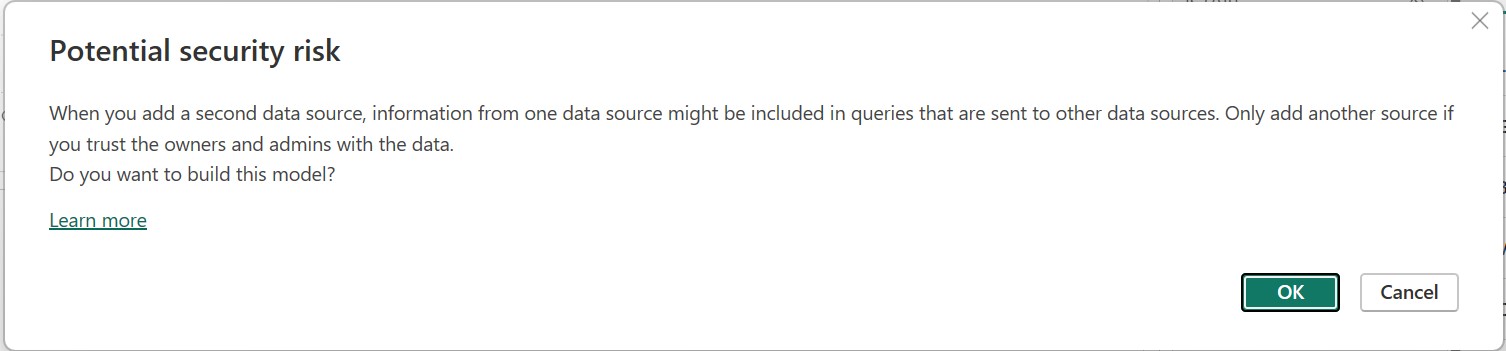
6- Click ok if a message is displayed.
7- The message “loading connection” will be displayed to the user, and it will disappear once the connection has been completed successfully.
8- Build a relationship between existing BPA dimensions and the “Dim – Selling party group”.
9- Click on the Model view in the left pane.
10- The Relationship diagram will be displayed.
11- Select “Dim – Selling party group” and drag it to the empty space on the relationship diagram.
12- “Dim – Selling party” table.
13- Select the key column on Dim – Selling party and drop it on dmo_sellingpartykey on the Dim – Selling party group.
14- A relationship dialog box will be shown.
15- Select cardinality as one-to-one and click save.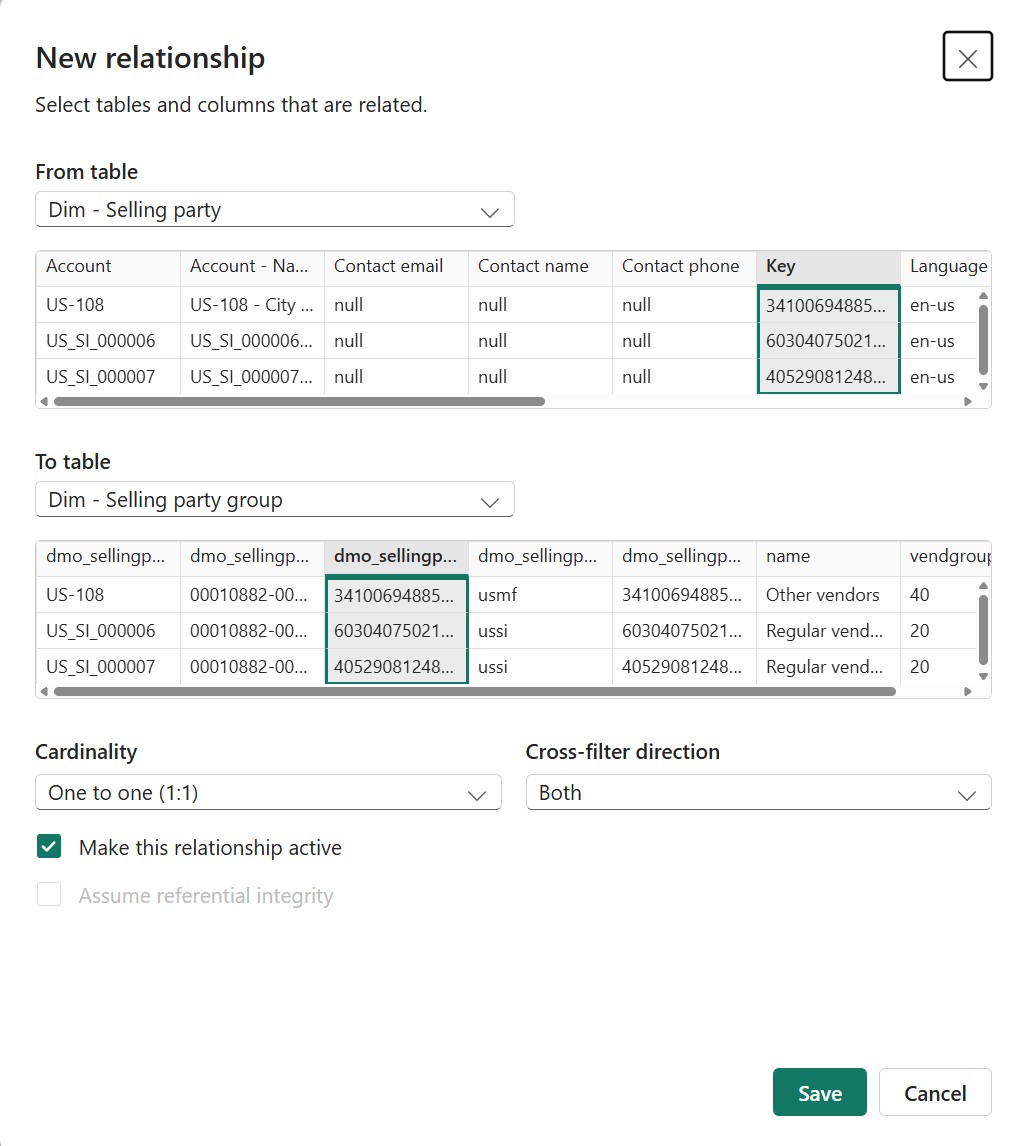
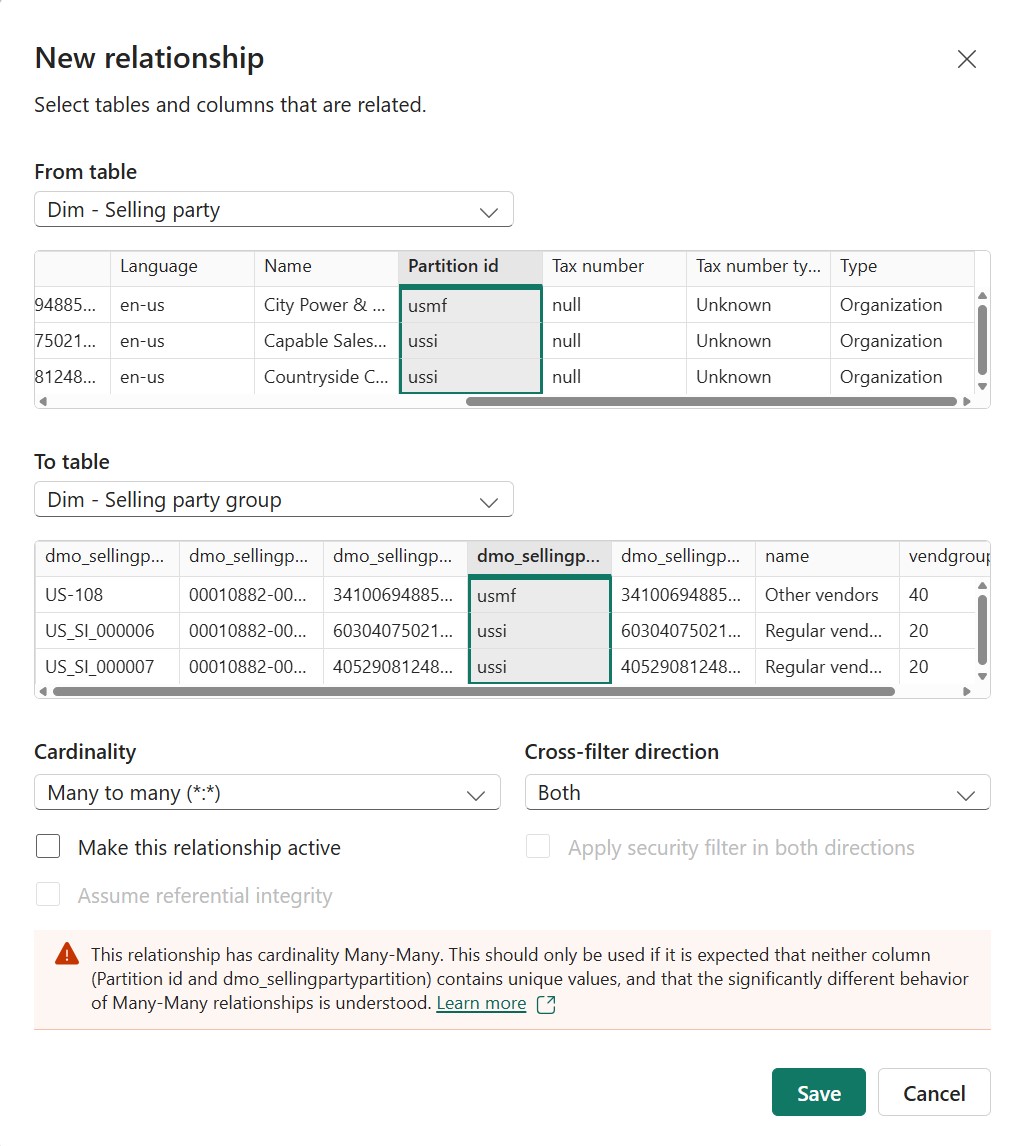
16- Select partitioned columns on Dim – Selling party and drop it on dmo_sellingpartition on the Dim – Selling part group.
17- A relationship dialog box will be shown.
18- Select cardinality as Many-to-many and click Save.
19- This completes the relationship between the BPA standard entity and the custom entity we created in the warehouse.
Step 13: Extend the report to include the Vendor group
1- Click on the report view section on the left to view the report.
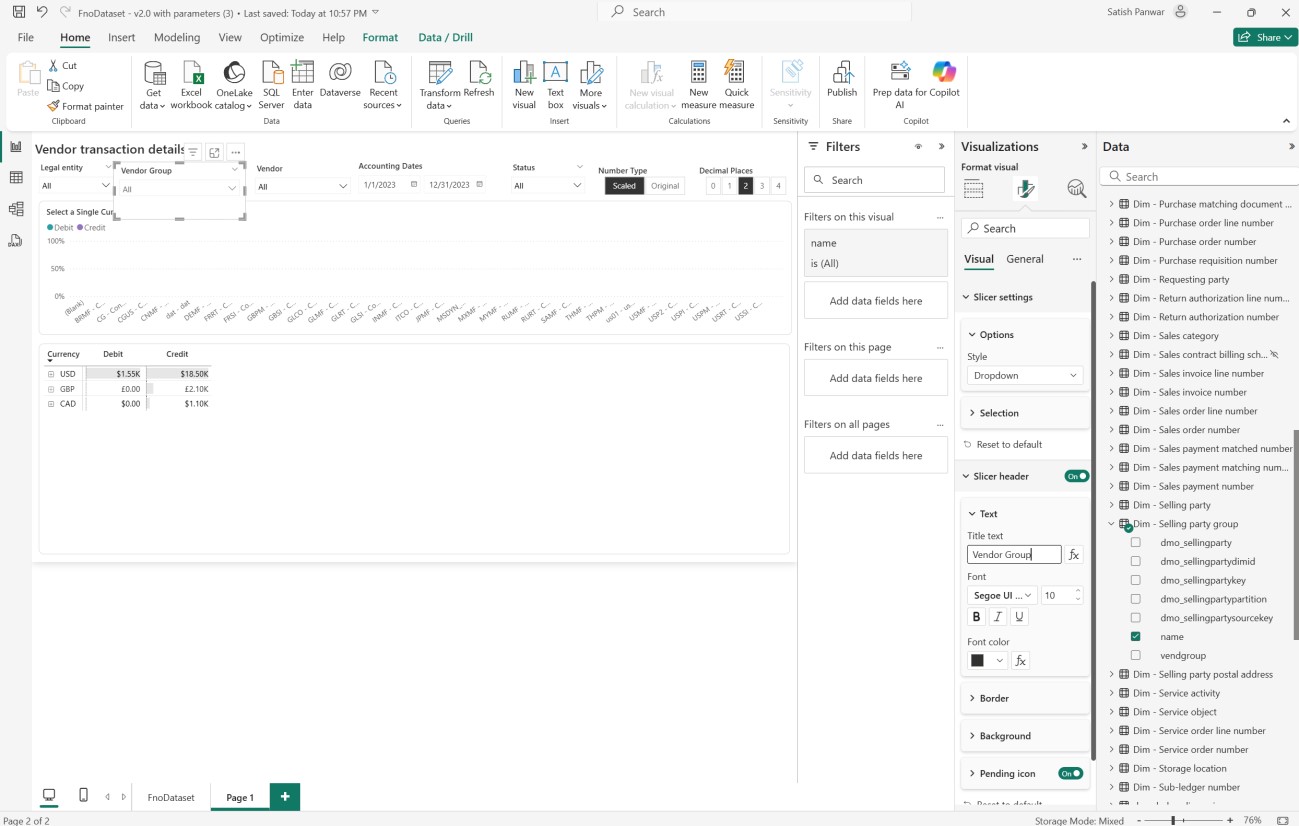
2- Click on the empty white space on the report and under Visualizations, click on the slicer icon.
3- Expand Dim-Selling party group, select name field and drop it under field.
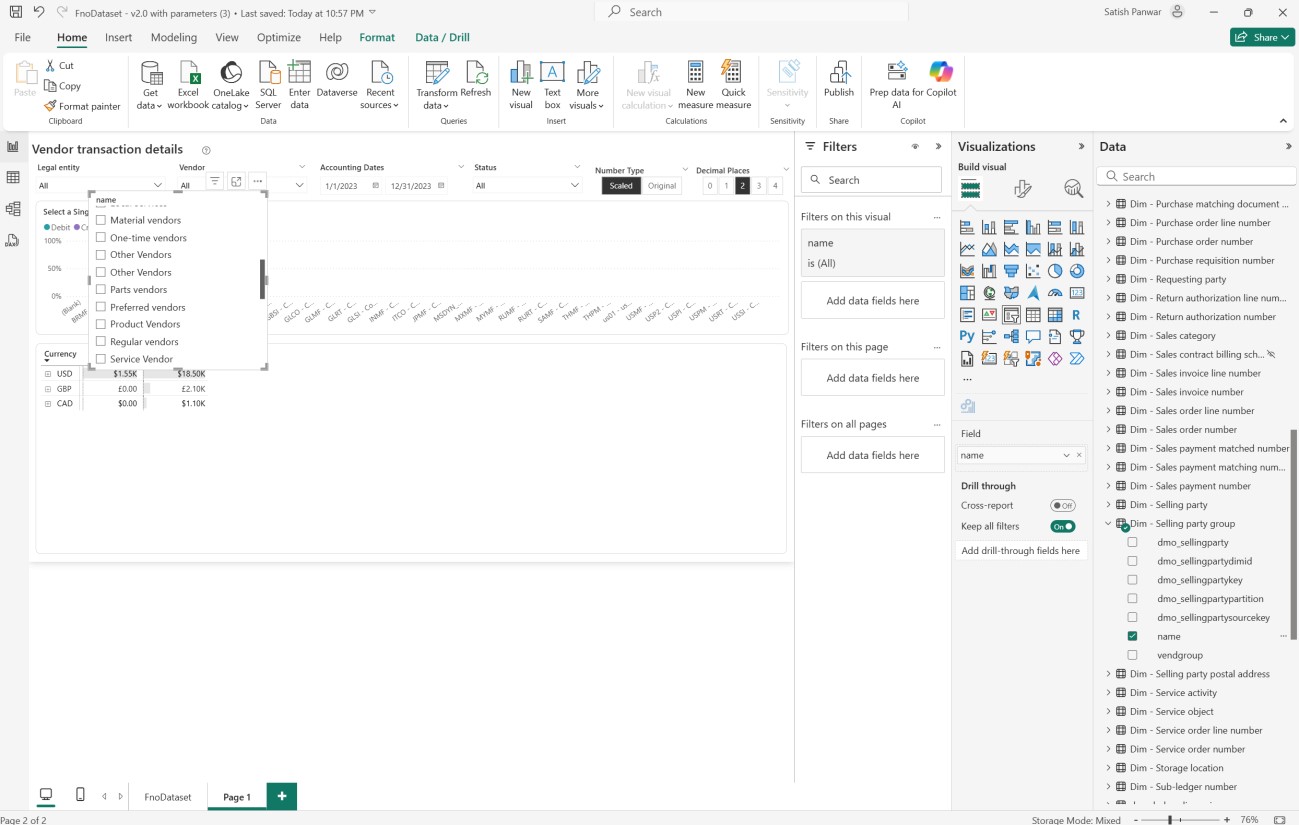
4- This populates the slicer with the required values.
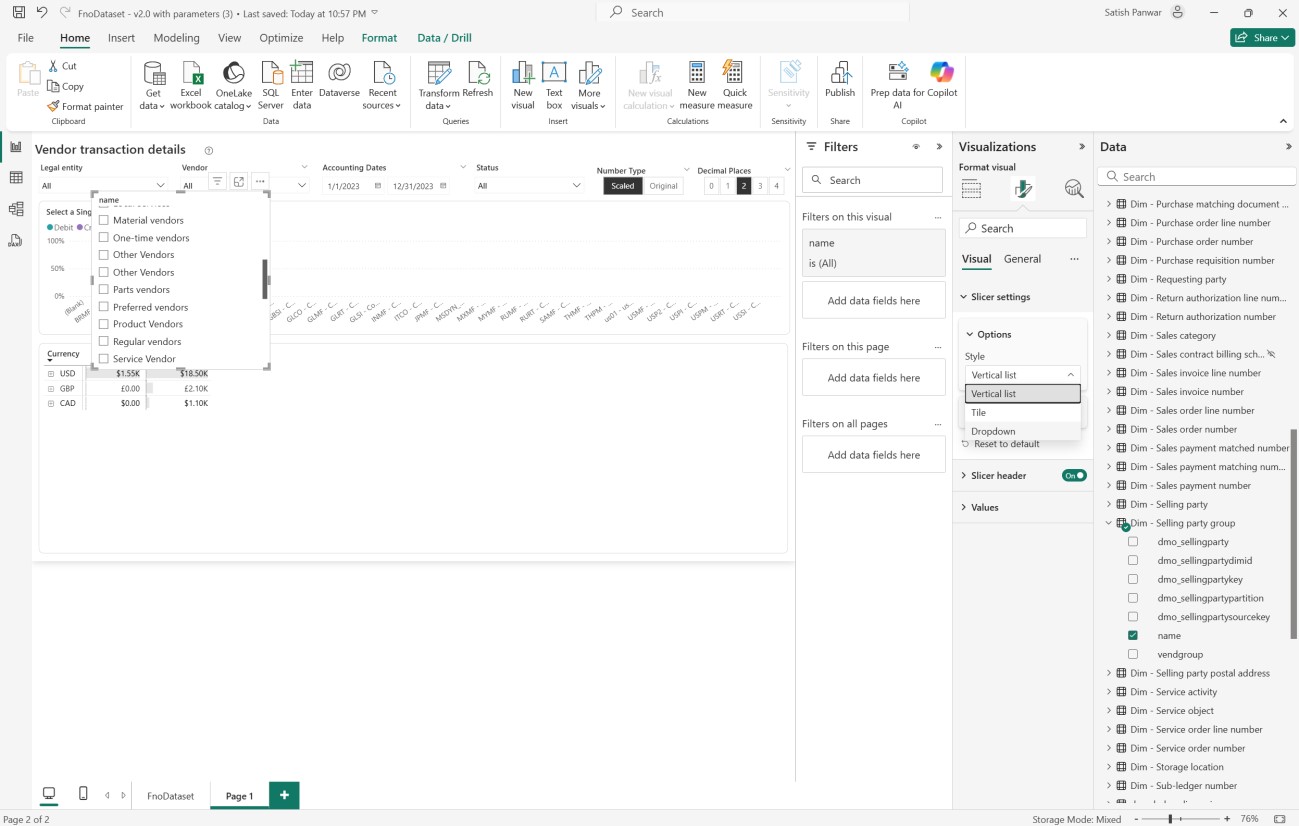
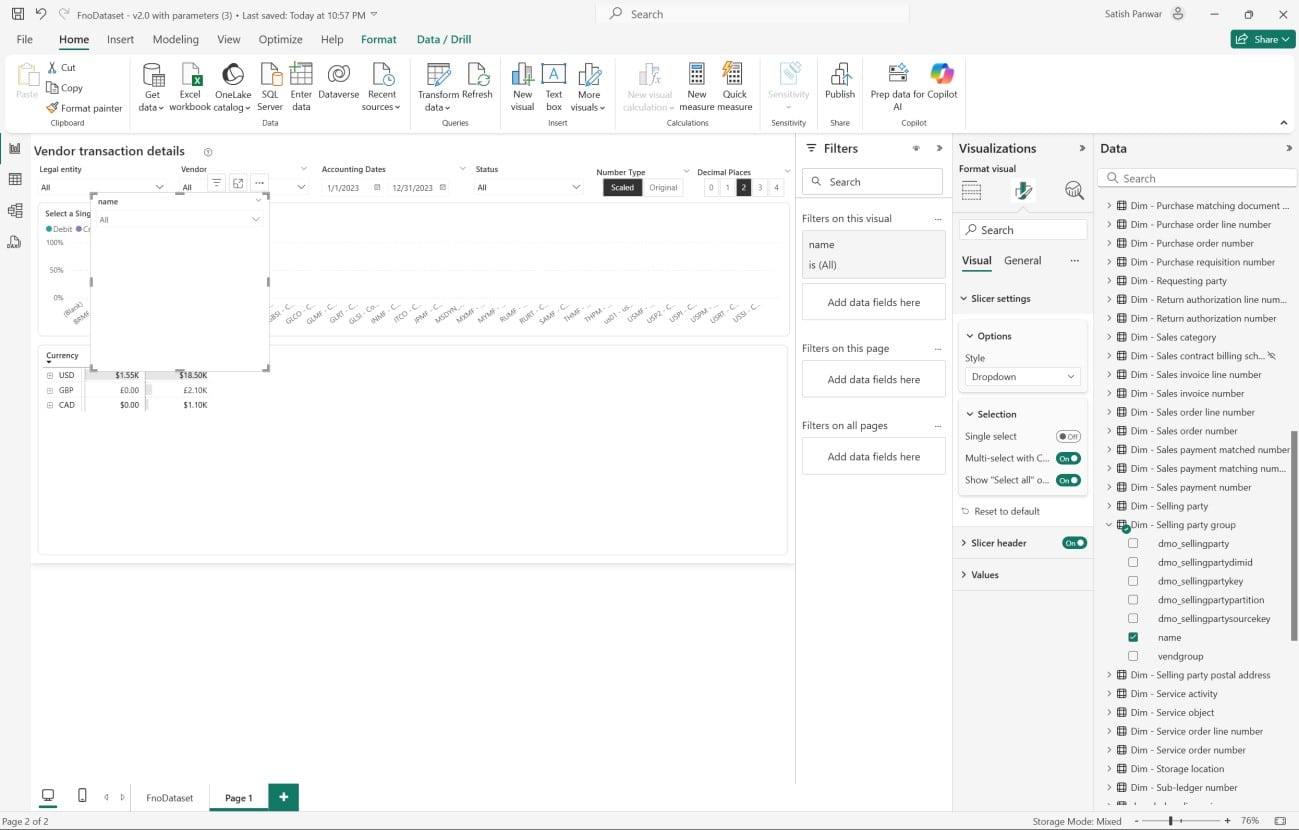
5- Under Visualizations > Format visual > Slicer settings > Options. Change Style from Vertical list to Dropdown.
6- Expand Selection under Slicer settings and set Show “Select all” options on.
7- Under slicer header, change Title Text from name to Vendor group. Adjust the location of the slicer to fit in the report parameters.
8- Select the control that displays the currency, Debit and credit columns.
9- Select the name from the Dim-Selling party group and drop it under the Rows section between Legal entity and Vendor account.
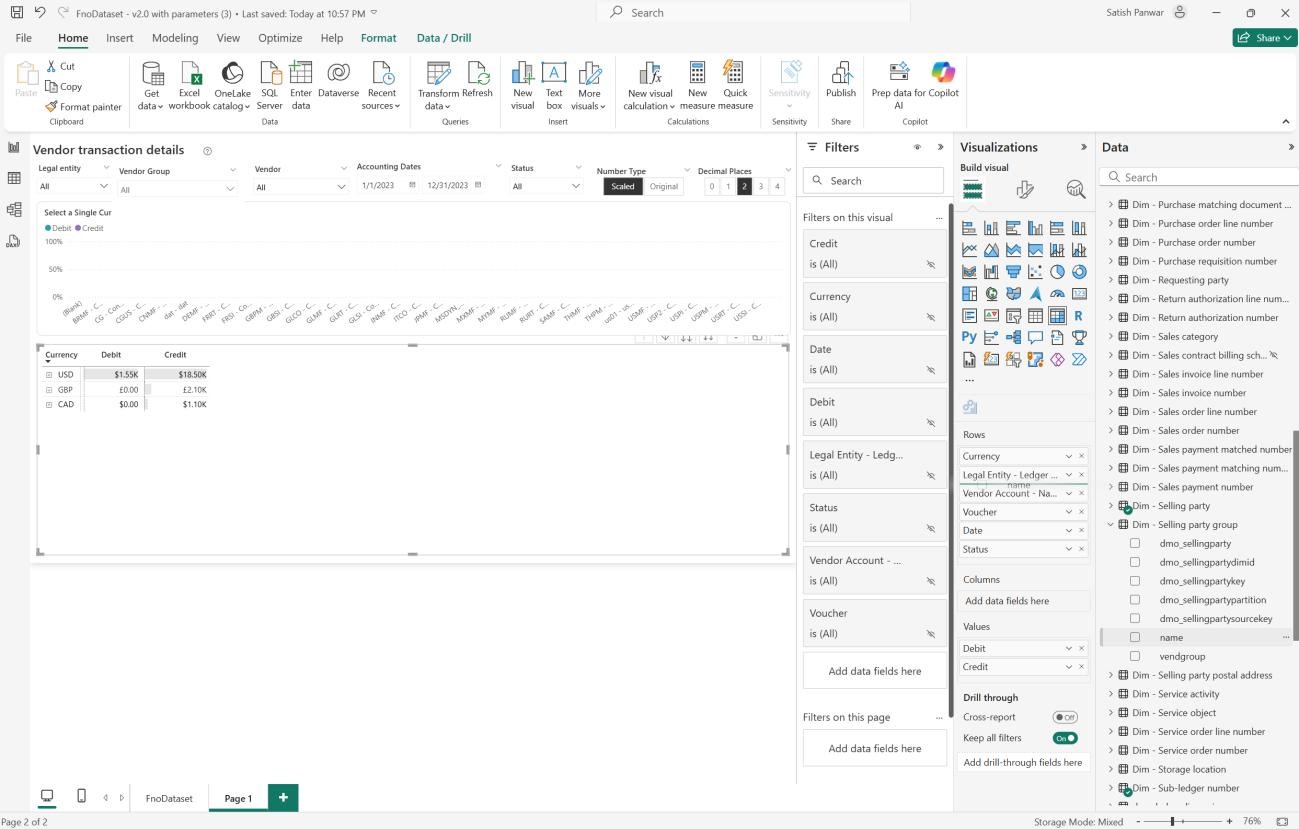
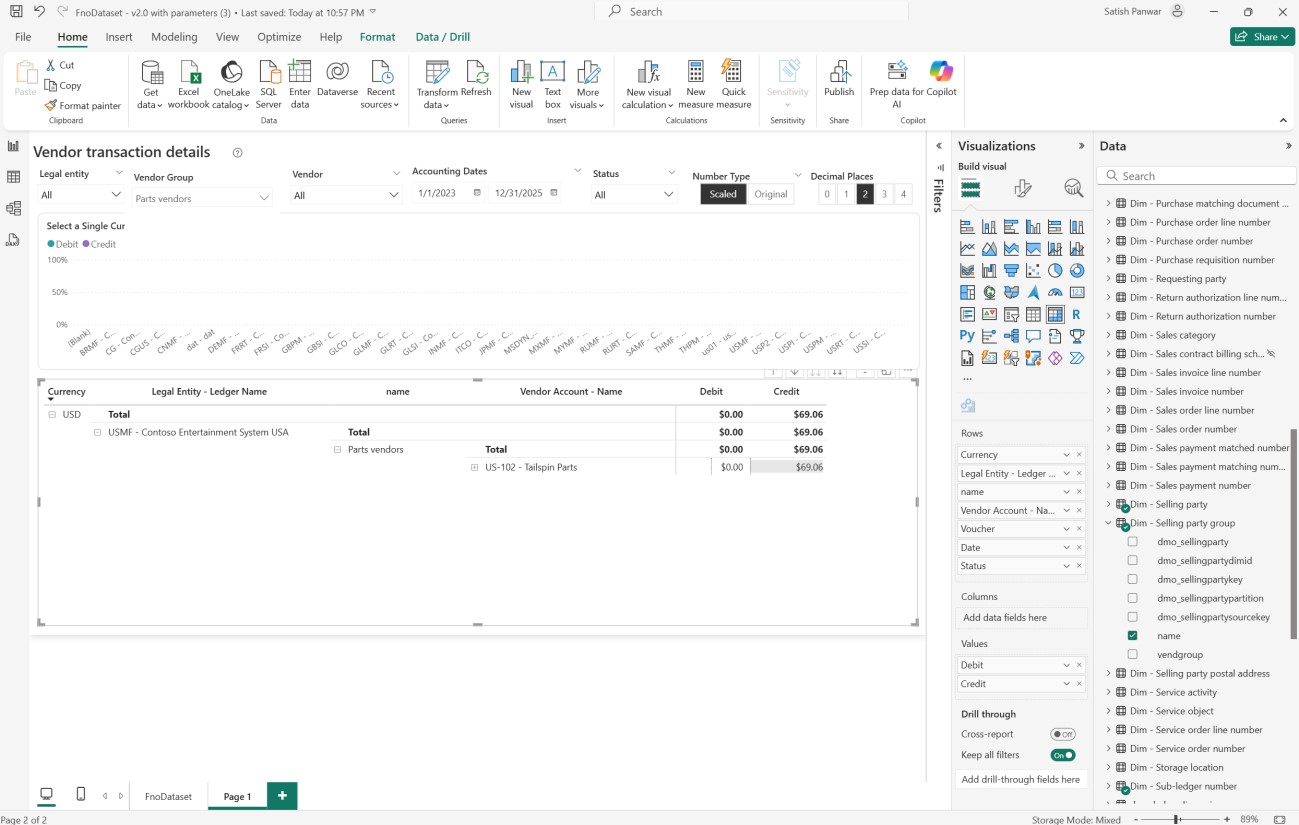
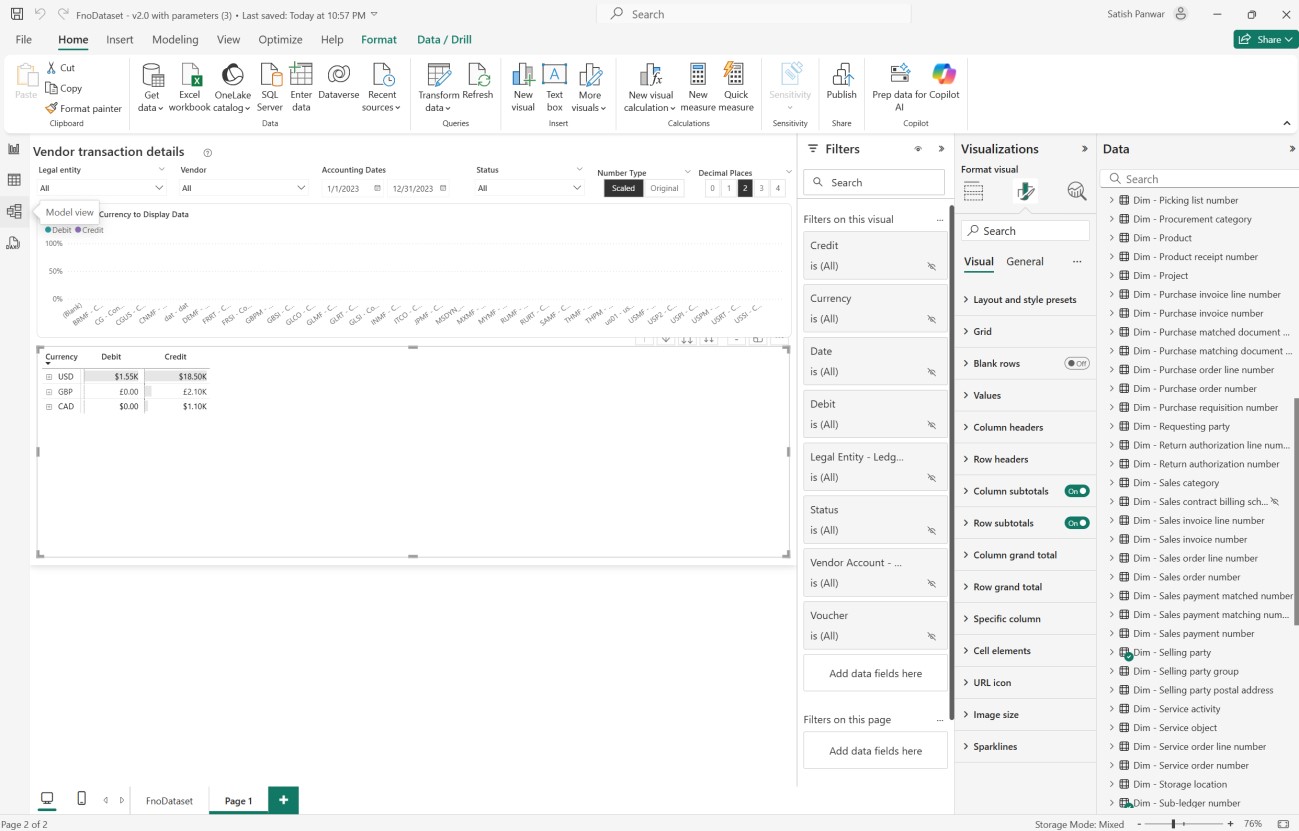
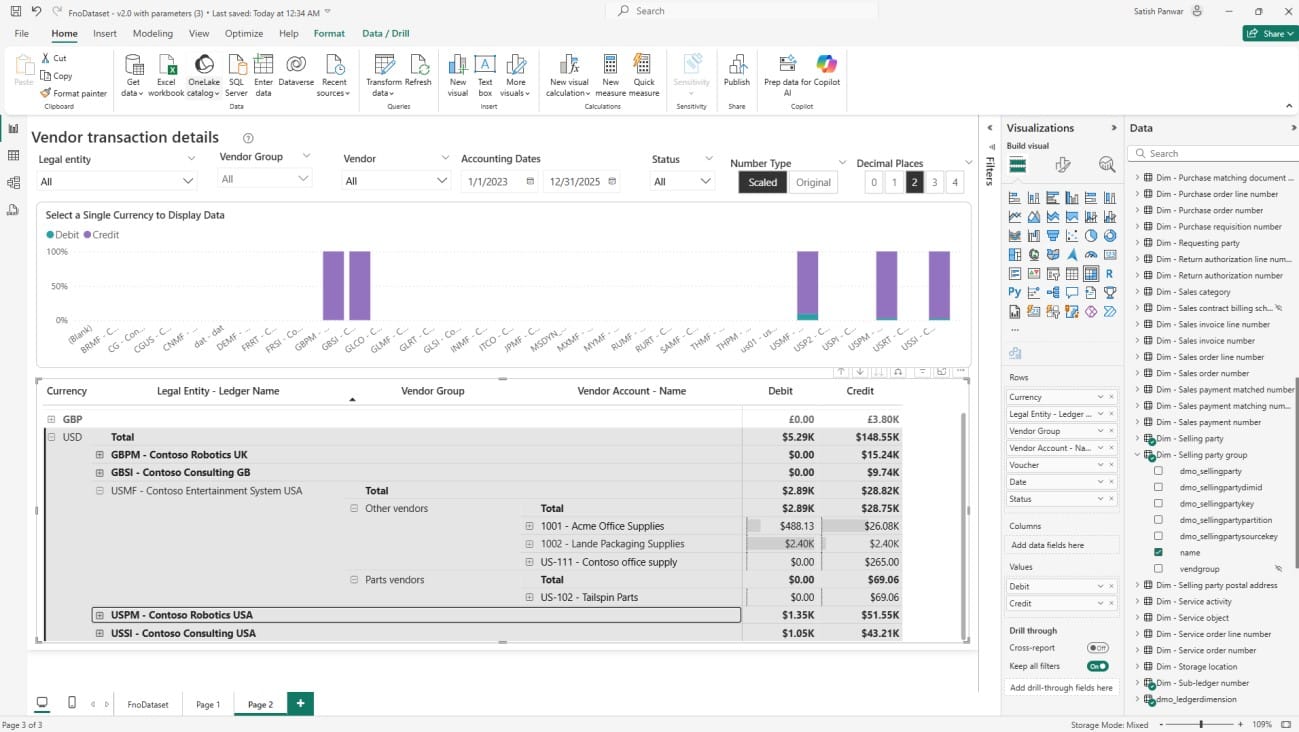
10- Now the report is ready to be tested.
11- Expand the currency column > Legal entity to view the vendor group column we just added.
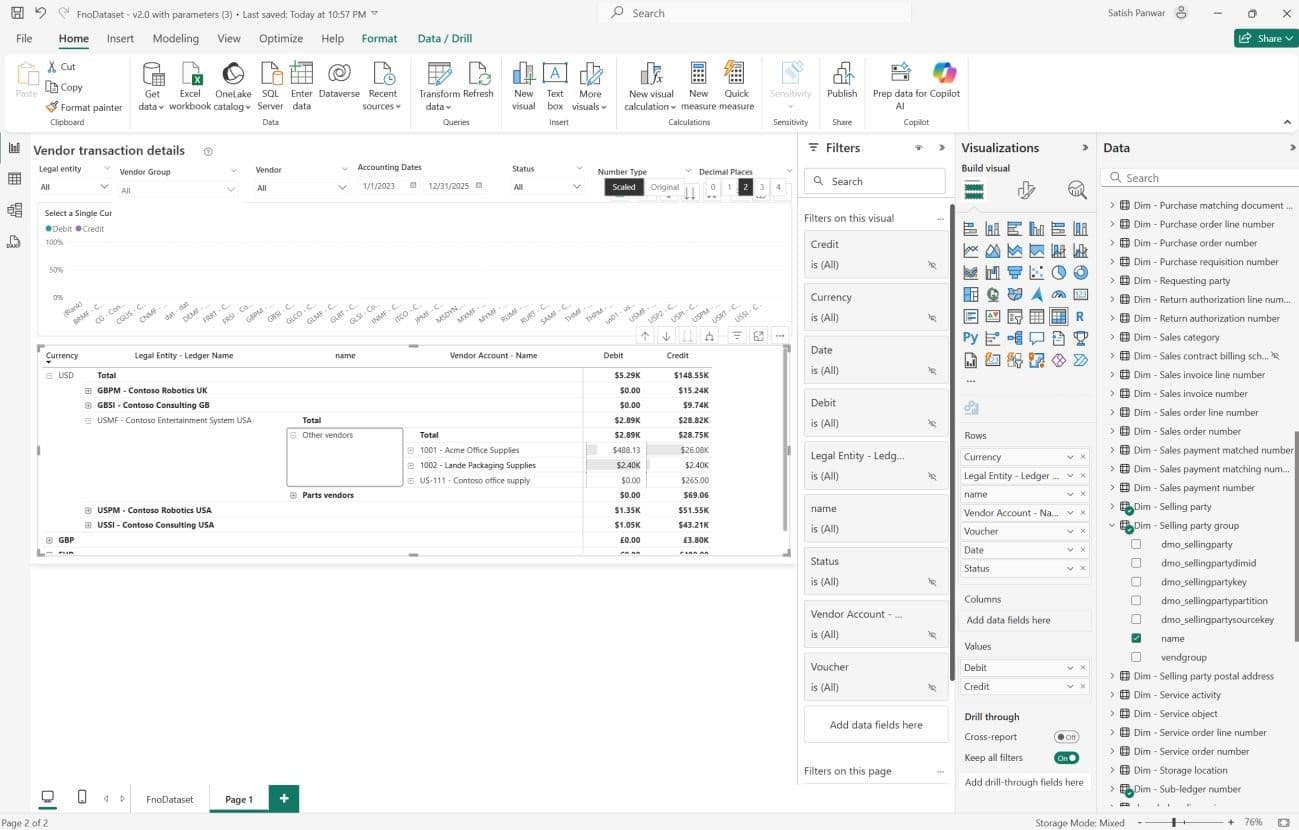
12- The slicer can be used to filter the report for a given vendor group.
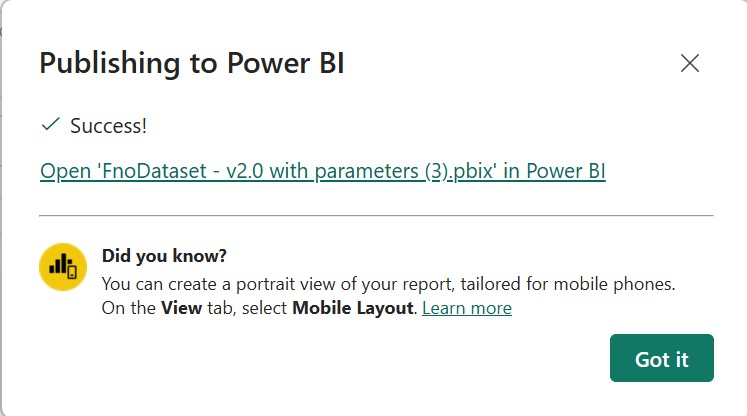
13- To save the report, click on the “Publish” button in the top ribbon.
14- Click Save.
15- Select the workspace and click Select.
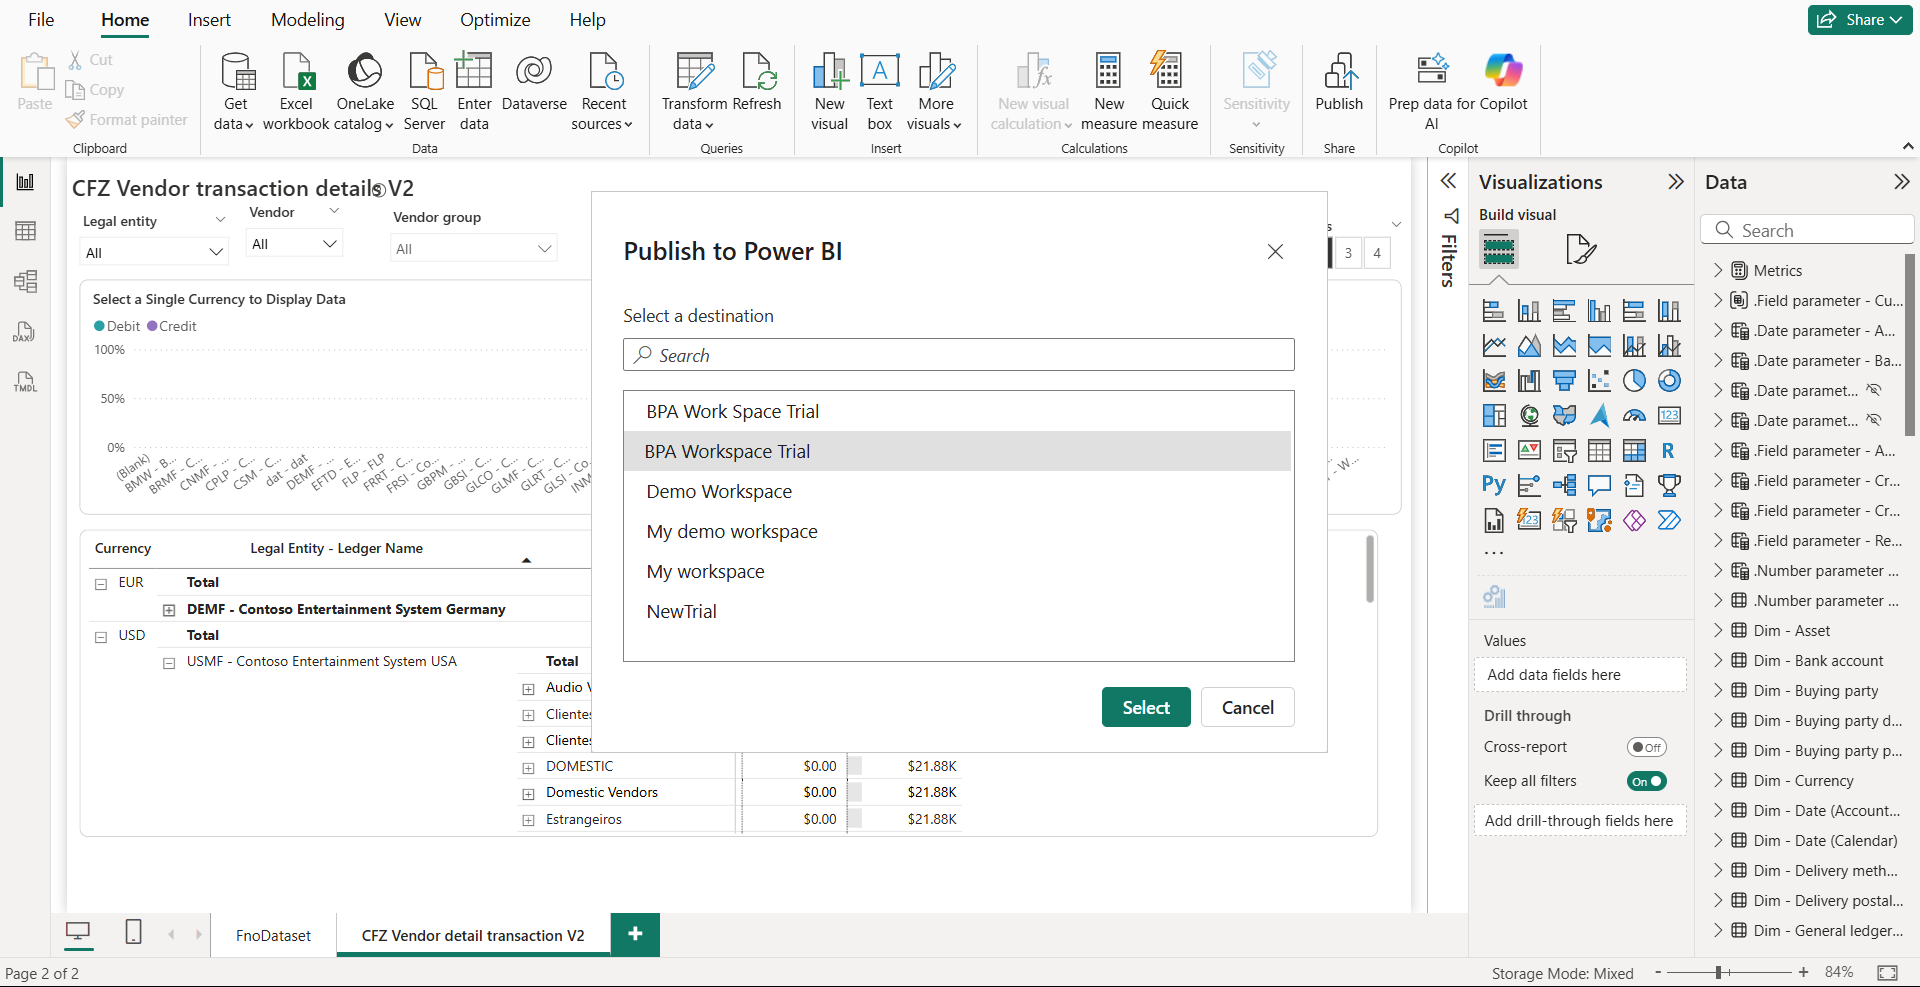
16- Publishing to Power BI message is displayed.
Conclusion
Extending Business Performance Analytics in Dynamics 365 Finance and Operations enables organizations to tailor reporting to their specific needs. By integrating BPA with Microsoft Fabric, Dataverse, and Finance tables, businesses can enhance standard reports, introduce filters such as Vendor Group, and create KPIs that align more closely with operational objectives. This extensibility enhances reporting accuracy, strengthens decision-making, and ensures analytics are truly business-driven.
At Confiz, we empower enterprises to unlock the full potential of Dynamics 365 Business Performance Analytics with scalable, secure, and customized solutions. From set up to advanced configuration, our experts ensure a smooth deployment that delivers actionable insights and lasting value.
Looking to extend Business Performance Analytics in D365 F&O? Contact us at marketing@confiz.com to get started.