
Debugging is a core competency for every Dynamics 365 F&O developer, and mastering it significantly improves both productivity and code quality. Whether you’re fixing defects, analyzing business logic failures, or validating extensions, understanding how to debug X++ code in D365 F&O is essential.
This guide walks you through the complete debugging process—using Visual Studio, attaching to IIS/IIS Express, handling symbols, debugging batch jobs, and applying X++ best practices—to help you streamline your D365 F&O debugging workflow.
Understanding X++ debugging in D365 F&O
X++ debugging in Dynamics 365 Finance and Operations focuses on identifying and resolving issues across customizations, extensions, and standard application logic. Effective debugging requires an understanding of how the D365 F&O environment executes code, the ability to use Visual Studio’s debugging tools correctly, and a structured approach to locating the root cause of an issue.
Whether you are debugging form events, class methods, batch jobs, or service integrations, the same core principles apply: know where the code runs, isolate the problem, and validate the behavior step by step.
Read more: How to configure RSAT for Dynamics 365 Finance & Operations: A step-by-step guide
Debugging X++ using Visual Studio
Visual Studio is the primary environment for X++ debugging in D365 F&O. To ensure a smooth debugging experience, follow the steps below in sequence—from launching Visual Studio correctly to attaching the debugger and loading symbols.
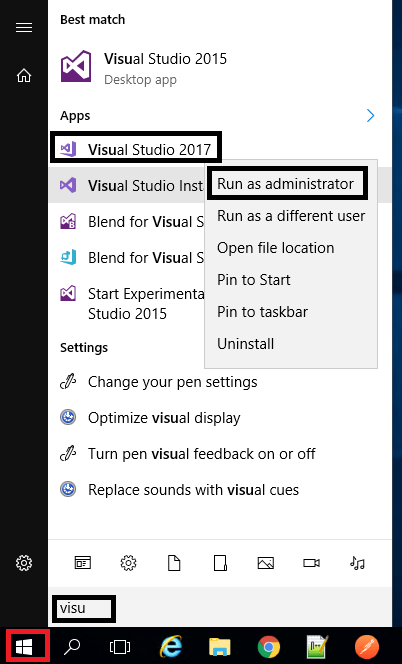
Step 1: Launch Visual Studio as an administrator
To debug properly, Visual Studio must run with elevated permissions:
- Search for Visual Studio in the Windows Start menu
- Right-click → Run as administrator
Running Visual Studio in admin mode is required to attach the debugger to D365 F&O service processes.
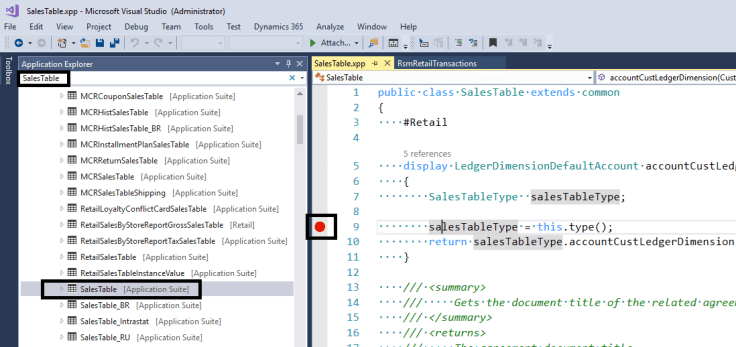
Step 2: Set breakpoints in X++ code
Breakpoints help pause execution at specific lines so you can inspect variables, logic, and flow.
To set breakpoints:
- Open Application Explorer (View → Application Explorer)
- Search for the object you want to debug (e.g., SalesTable, forms, classes)
- Right-click → View code
- Add breakpoints using F9 or by clicking the left margin
Place breakpoints only in relevant sections to reduce unnecessary pauses during debugging.
To debug X++ in Dynamics 365, you must attach Visual Studio to the correct web process that executes the D365 F&O application.
Take control of your business operations
Discover how Confiz services can simplify your complex workflows and improve decision-making.
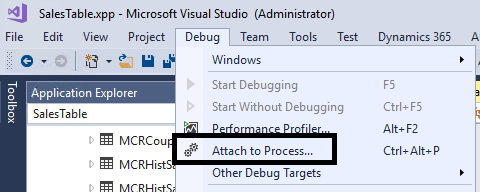
Get a Free QuoteStep 3: Attach to the running process
In Visual Studio:
Debug → Attach to Process
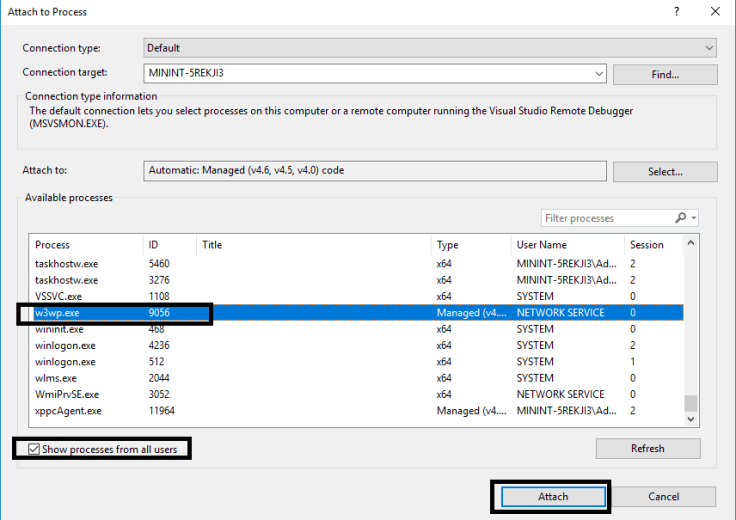
Step 4: Select the correct service
Enable Show processes from all users, then attach to one of the following:
- iisexpress.exe — most common for developer VMs
- w3wp.exe — used when the site runs under IIS
If neither appears:
- Confirm the D365 F&O website is running
- Ensure Visual Studio is running as Administrator
Debugging batch jobs
Batch jobs are completed under a separate process:
- Batch.exe
To debug X++ batch jobs in Dynamics 365, attach Visual Studio to Batch.exe instead of IIS/IISExpress.
Step 5: Load symbols if modules do not load
1. Open the modules window
While your code is running under the debugger.
- Go to the menu:
Debug → Windows → Modules - The Modules window will appear — it lists all DLLs (modules) loaded by the process.
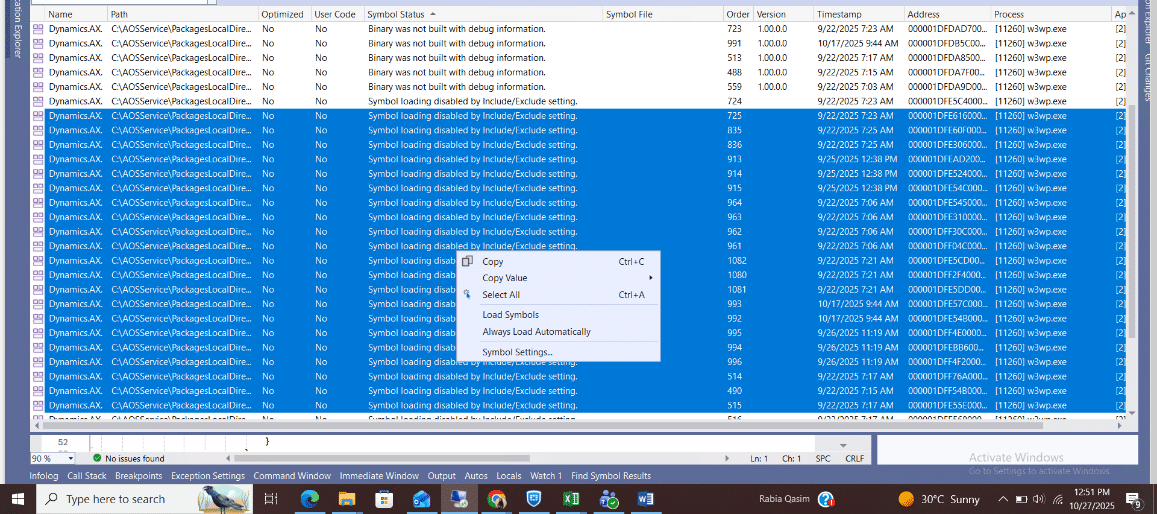
2. Manually load the symbols
To manually load a symbol file for that module:
- Right-click on the module in the list.
- Select Symbols with status Symbol loading disabled by Include/Exclude setting
- Right-click and load symbols.
- After loading, the Symbol Status should change to Symbols loaded.
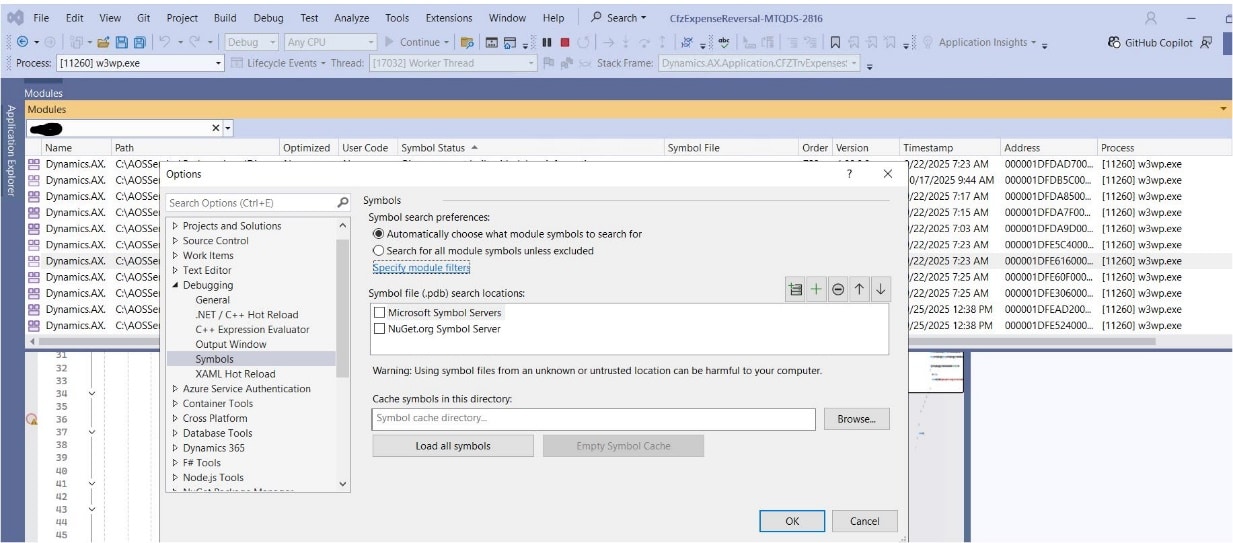
3. Make sure symbol paths are configured
You can also configure the default symbol path, so you don’t have to do this manually each time.
- Go to: Tools → Options → Debugging → Symbols
- Then add:
- C:\AOSService\PackagesLocalDirectory\Bin
- C:\AOSService\PackagesLocalDirectory\<ModelName>\Bin
and enable “Load all modules, unless excluded”.
4. (Optional) Use “load automatically” for your modules
You can set Visual Studio always to load certain symbols automatically:
- In the Modules window, right-click your module → Symbol Load Information.
- Copy the symbol path.
- Add it permanently to:
Tools → Options → Debugging → Symbols
- Next time you attach to the process, symbols load automatically.

X++ debugging best practices
Successful debugging depends not only on tools, but also on how the underlying code is written and organized. Following these X++ best practices helps simplify troubleshooting and reduce time spent identifying issues.
Further readings: Streamlining development with unified developer experience for Finance and Operations apps
1. Write clear, maintainable code
Use meaningful variable and method names, follow standard D365 F&O naming conventions, and add comments where needed. Clean code is always easier to debug.
2. Use breakpoints intentionally
Place breakpoints at specific logical points in the code instead of scattering them throughout the method. This keeps the debugging process focused and efficient.
3. Implement proper exception handling
Use try/catch blocks to isolate errors and log meaningful details. This helps you quickly identify where and why failures occur.
4. Use infolog for tracing
Leverage Infolog messages to output diagnostic information such as variable values, flow checkpoints, or validation messages.
5. Understand the execution context
Code behaves differently depending on where it runs:
- Batch processing
- Interactive client sessions
- Service calls
Always confirm the execution context before beginning your debugging session.
6. Debug extensions with care
Extensions may load differently than over-layered code. Ensure the event handlers or extensions you created are being triggered during execution.
7. Validate data using the table browser
Use the built-in Table Browser to inspect and verify table data. This is especially useful when debugging issues tied to incorrect or unexpected data.
8. Optimize queries and data access
For performance-related issues, review queries, joins, and indexes. Inefficient data access patterns often cause slow or unexpected behavior.
9. Enable debug mode in IIS when needed
If you’re debugging UI-driven logic or service-based interactions, enabling debug mode in IIS can improve visibility and compatibility with Visual Studio.
Accelerate growth at an unprecedented pace
Discover how Confiz can help you take control of your daily operations, increasing growth and revenue.
Book a Free ConsultationDebugging common X++ scenarios in D365 F&O
1. Form logic errors
Debugging forms involves setting breakpoints in data source methods or event handlers like init(), modified(), or clicked().
2. Batch jobs
Use the batch job history and log files to identify issues. Debug the associated class by running it interactively in Visual Studio.
3. Service integration
Debug custom services by attaching the debugger to the IIS process. Monitor the request and response data to identify issues.
Troubleshooting debugging issues
Even with the right setup, debugging may fail due to configuration, catching, or symbol issues. Use the following checklist to resolve common problems.
1. Debugger not attaching
- Ensure Visual Studio is running with administrator privileges
- Confirm you selected the correct process (iisexpress.exe, w3wp.exe, or Batch.exe)
- Verify that the website or batch service is running
2. Breakpoints not hit
- Confirm that symbols are loaded correctly
- Perform a full build in Visual Studio
- Synchronize the database if metadata or table structure has changed
Breakpoints that aren’t triggering usually indicate a symbol mismatch or an incorrect build state.
3. Debugging feels slow or inefficient
- Focus on smaller sections of code to isolate issues
- Reduce the number of active breakpoints
- Run specific logic inside a test class or job to avoid full form initialization
Optimizing the debugging workflow helps reduce wait times and improves precision.
Collaboration & continuous improvement
Debugging is most effective when approached as a collaborative effort.
- Share debugging findings, logs, and patterns with your team
- Conduct peer reviews to catch issues earlier in development
- Stay updated through Microsoft Learn and the Dynamics Community
Mastering X++ debugging is an evolving skill. With consistent practice and the right techniques, developers can diagnose issues faster, improve code quality, and deliver more reliable D365 F&O customizations.
Conclusion
Effective X++ debugging is essential for maintaining reliable customizations in Dynamics 365 Finance & Operations. By using Visual Studio correctly, attaching to the appropriate processes, and following structured debugging practices, developers can identify issues faster and improve overall code quality.
The techniques covered in this guide apply across common scenarios—forms, batch jobs, and service integrations—making debugging more predictable and efficient.
For support with D365 F&O development or debugging, contact us at marketing@confiz.com.