How to build a Data Warehouse in Microsoft Fabric: A guide for data professionals

May 13, 2024

Extracting meaningful insights from a diverse data pool is daunting for data-driven organizations. Traditional data storage solutions often struggle to provide the necessary structure and arrangement for effective analysis. Here, Microsoft Fabric, with its data warehousing capabilities, offers a compelling solution to help you manage, store, and analyze your data.

Microsoft Fabric’s data warehouse is revolutionizing the traditional data warehouse concept by offering a unified and AI-powered platform for data management and analytics. This scalable platform allows organizations to break down data silos and consolidate their data assets into a single, cohesive repository to gain a comprehensive view of their data landscape.

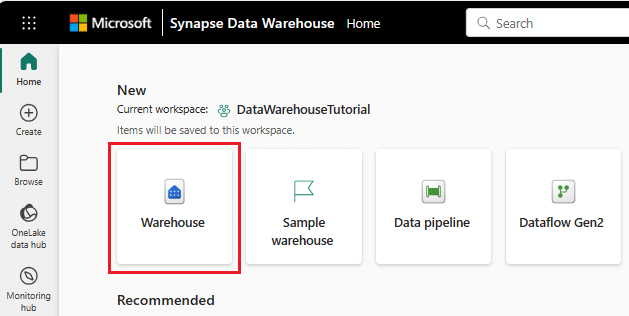
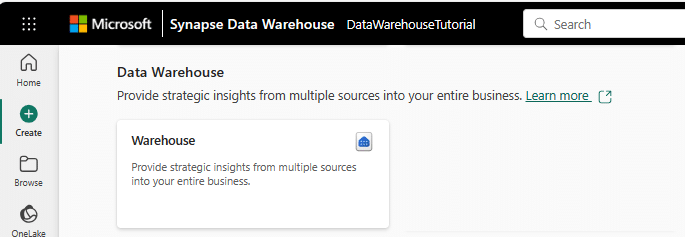
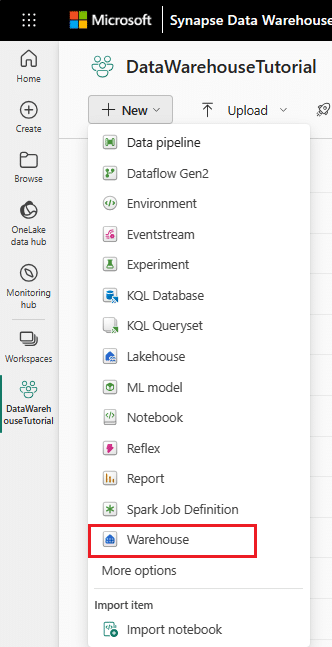
Getting started with a data warehouse and creating your own warehouse in Fabric Microsoft is simple. This blog post explains the concepts of data warehouses in Microsoft Fabric and explores its multiple functionalities and offers a comprehensive guide to building your first warehouse within the Fabric ecosystem.

Data warehouse experience in Microsoft Fabric

The data warehouse in Microsoft Fabric is a fully managed, scalable, and highly available data warehouse that allows users to store and query data in the Lakehouse. With a user-friendly SaaS experience that seamlessly integrates with Power BI, a powerful Business Intelligence tool, for effortless analysis and reporting, warehouse in Fabric combines data lakes and warehouses to simplify the investment required for an organization’s analytical infrastructure.

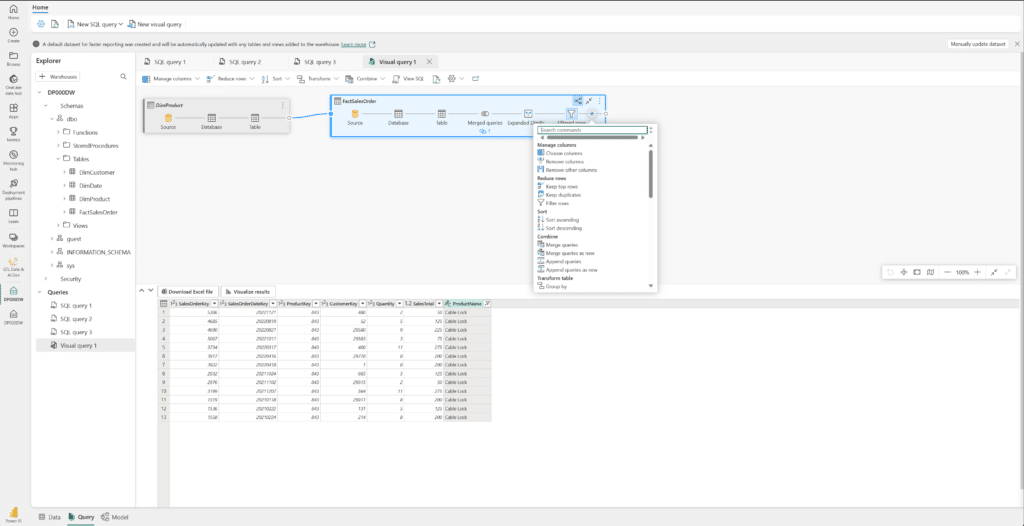
With a data warehouse, users can create tables, load, transform, and query data through the Fabric portal and T-SQL commands. They can either use SQL to query and analyze the data or opt for Spark to handle data processing and the creation of machine learning models.

Within Fabric’s data warehouses, data engineers and analysts collaborate seamlessly within a unified environment. Data engineers build a structured layer (relational layer) on the Lakehouse, allowing analysts to use T-SQL and Power BI for thorough data exploration.

Further readings: Explore the key differences between data lake and data warehouse.

Types of Data Warehouse in Microsoft Fabric

Microsoft Fabric offers two distinct types of data warehousing. These includes the SQL analytics endpoint of the Lakehouse and Synapse Data Warehouse.

Type 1: SQL endpoint of the Lakehouse

Microsoft Fabric offers a unique feature: the SQL analytics endpoint. This endpoint essentially functions as a data warehouse automatically generated from Lakehouse in Microsoft Fabric. Users can seamlessly transition between two data access methods within the same Lakehouse:

  • Lake view: This view caters to data engineering and Apache Spark.
  • SQL view: The SQL analytics endpoint operates in read-only mode, with data modification exclusively accessible through the “Lake” view using Spark.

The SQL analytics endpoint within the Lakehouse offers a subset of SQL commands specifically designed for defining and querying data objects. However, data manipulation (create, update, delete) functionalities are not supported through this interface.

  • Users can perform the following series of actions in the SQL analytics endpoint.
  • Query the tables that reference data in your Delta Lake folders in the lake.
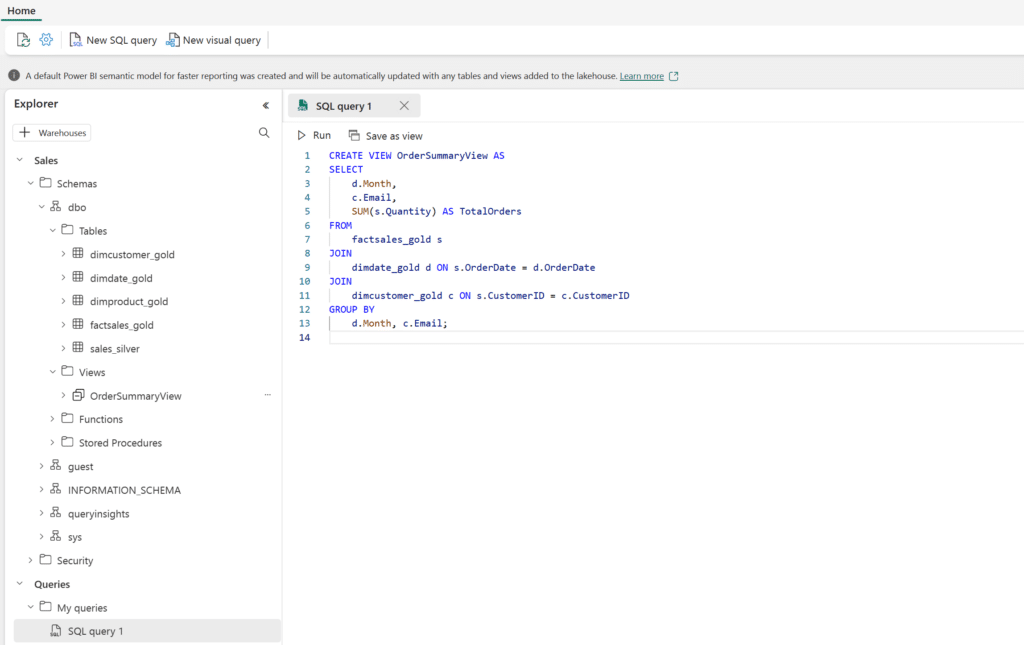
  • Create views, inline TVFs, and procedures to encapsulate your semantics and business logic in T-SQL.
  • Manage permissions on the objects.

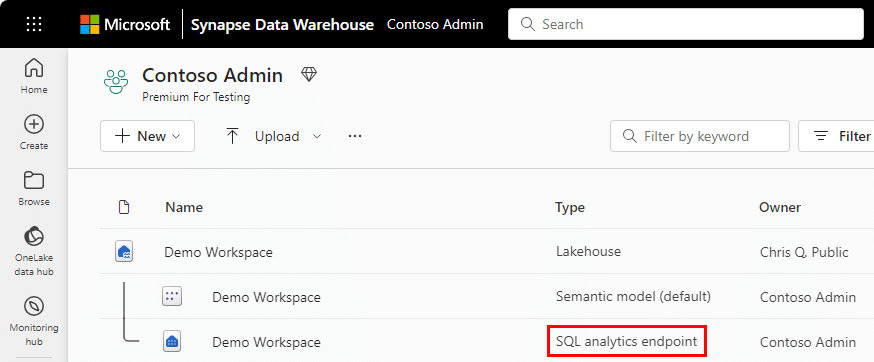
The SQL analytics endpoint is readily identifiable within the Microsoft Fabric workspace by the label “SQL analytics endpoint” displayed in the “Type” column. Every Lakehouse is equipped with an automatically generated SQL analytics endpoint, accessible through familiar SQL tools like SQL Server Management Studio, Azure Data Studio, and the Microsoft Fabric SQL Query Editor.

Type 2: Synapse Data Warehouse

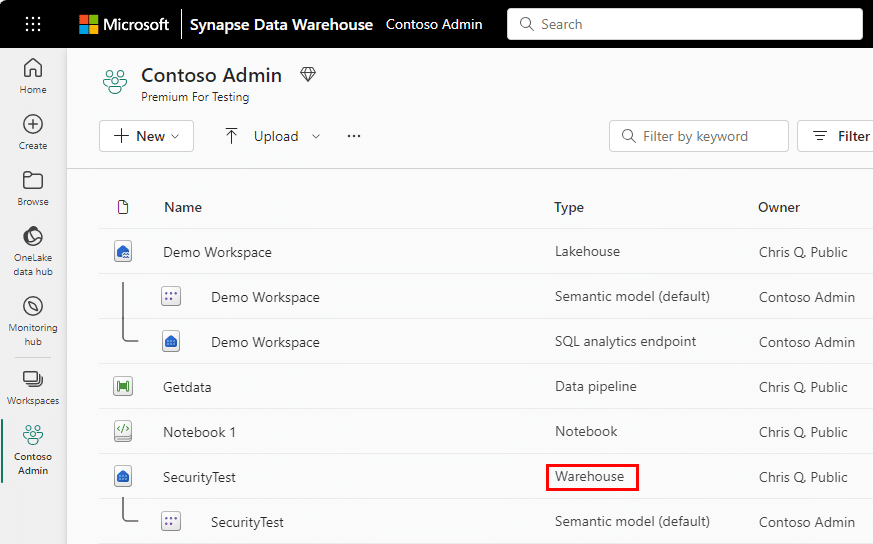
Data warehouses within the Microsoft Fabric workspace are clearly distinguished by the “Warehouse ” label displayed in the “Type” column. Compared to SQL endpoints, these warehouses offer a broader range of functionalities. They support querying data (DML), enable data definition tasks (DDL), and even handle transactions.

While SQL endpoints within Microsoft Fabric are limited to read-only queries, view creation, and temporary function definition, warehouses provide a more comprehensive feature set. Notably, warehouses are user-created and fully support transactional DDL and DML operations. Data population within warehouses can be achieved through various supported methods, including COPY INTO, pipelines, dataflows, or even cross-database ingestion techniques like CREATE TABLE AS SELECT (CTAS), INSERT..SELECT, or SELECT INTO.

Building a data warehouse in Microsoft Fabric

Before creating a warehouse, users need to enable Fabric and then go to the Fabric portal. There are w three different approaches to creating a warehouse:

Option 1: The Home hub

Users can create the warehouse from the Home hub by clicking on the Warehouse card under the New section. Upon selection, an empty warehouse will be generated, allowing you to begin creating objects within it. You can use sample data for a quick start or load your test data according to your preference.

Option 2: The Create hub

Users can also create the warehouse through the Create hub by choosing the Warehouse card with the Data Warehousing section. An empty warehouse will be generated upon selection, allowing you to create objects in the warehouse or get started using a sample.

Option 3: The workspace list view

To create a warehouse using the workspace list view, go to your workspace, click on + New option then click on Warehouse to create a warehouse.

Once you have created your own warehouse, begin loading data into your warehouse.

Data ingestion into the warehouse

Microsoft Fabric offers built-in data ingestion tools to seamlessly ingest data into the warehouse. These tools facilitate data ingestion into the warehouse at scale, offering users the choice between code-free and code-rich experiences. Following data ingestion, the data becomes accessible for analysis by various business groups, leveraging functionalities, such as cross-database querying and sharing.

Data ingestion methods

Microsoft Fabric data warehouse supports ingesting data through four different methods. These methods include Pipelines, Dataflows, cross-database queries, and the COPY INTO command.

  • COPY (Transact-SQL)

With the COPY statement, you can access versatile, high-throughput data ingestion from an external Azure storage account. Incorporate the COPY statement into your current Transact-SQL code for ETL/ELT processes.

  • Data pipelines

With pipelines, users can effortlessly achieve data ingestion through a code-free or low-code experience. These pipelines empower users to orchestrate robust workflows for a full Extract, Transform, Load (ETL) process. This includes functionalities for setting up the destination environment, executing custom Transact-SQL scripts, performing lookups, and transferring data from source to destination.

  • Dataflows

Dataflows provide an alternative to pipelines, offering a seamless, visual, code-free experience for effortless data preparation, cleansing, and transformation.

  • Cross-warehouse ingestion

Data ingestion from workspace sources is also achievable. This might be necessary if there’s a requirement to create a new table with a subset of a different table or due to the integration of diverse tables within the warehouse and Lakehouse. In cross-warehouse data ingestion, Transact-SQL functionalities like INSERT…SELECT, SELECT INTO, or CREATE TABLE AS SELECT (CTAS) operate across different warehouses within the same workspace.

Table creation in the warehouse

Data warehouse offers two approaches to creating a table in the warehouse. These include:

  1. Use SQL Server Management Studio (SSMS) or another SQL client to establish a connection to the data warehouse and run a CREATE TABLE statement.
  2. If you prefer a no-code approach, the Fabric UI offers a user-friendly interface for table creation.

Moreover, you can also create and populate the table using the results of a select statement. The following T-SQL commands illustrate how to create a table.

T-SQL StatementDescription
CREATE TABLECreates an empty table by defining all the table columns and options. 
CREATE TABLE AS SELECTPopulates a new table with the results of a select statement. The table columns and data types are based on the select statement results. To import data, this statement can select from an external table. 

Data warehouse query application in Fabric

Data warehouse in Microsoft Fabric offers two ways to query data.

  1. The Visual query editor
  2. The SQL query editor

The Visual query editor

The Visual query editor uses a no-code, drag-and-drop experience to create queries. This editor offers an experience like Power Query’s online diagram view. This intuitive interface makes it easy to create complex queries without writing code. Simply click the “New visual query” button to get started.

To begin, drag a table from your data warehouse onto the canvas. Then, use the Transform menu located at the top of the screen to incorporate columns, filters, and other modifications into your query. Alternatively, you can use the (+) button directly on the visual to execute similar transformations.

The SQL query editor

The SQL query editor offers a query experience that includes IntelliSense, code completion, syntax highlighting, client-side parsing, and validation. To begin a new query, access the New SQL query button from the menu. This feature allows you to compose and execute your T-SQL queries conveniently.

Report creation on data warehousing in Fabric

Microsoft Fabric empowers users to create reports using their warehouse or SQL analytics endpoint and default Power BI semantic models.

This article describes the various ways you can use your Warehouse or SQL analytics endpoint, and their default Power BI semantic models, to create reports.

For reports that use warehouse or SQL analytics endpoint, you can use one of the following tools to create reports:

  1. Report creation using the Power BI persona
  2. Report creation using the Power BI desktop

Report creation using the Power BI service

In the Data Warehouse, click on the “New report” button using the ribbon and the main home tab. This option offers a seamless and quick approach to creating reports directly using the default Power BI semantic model.

Report creation using Power BI Desktop

In Power BI Desktop, users can create reports directly from semantic models by establishing a Live connection to the default semantic model. When searching for a particular OneLake SQL endpoint or Warehouse, Power BI Desktop’s OneLake data hub acts as a built-in directory that allows users to connect and generate reports easily.

Read more: Inside Microsoft Fabric: The role of Power BI in generating BI insights.

Get the most out of Microsoft Fabric: Optimize your data strategy with Confiz

Data warehouses serve as centralized repositories of historical data, empowering data-driven decision-making through insights derived from trends and patterns. Incorporating a data warehouse into your tech stack, especially within Microsoft Fabric, can significantly enhance your analytical capabilities. If you are new to data warehousing or exploring Microsoft Fabric’s potential within your existing environment, Confiz offers expert guidance. Our proficiency in Microsoft Fabric extends from consulting and implementation to migration, ensuring seamless integration with the Microsoft tech stack, including Power BI. Let us help you evaluate your requirements and tailor a data warehouse solution to meet your specific needs.

Ready to take the next step in optimizing your data strategy? Contact us today at marketing@confiz.com to discuss how we can tailor solutions to meet your specific needs.