With business landscapes evolving faster than ever, getting real-time insights into your data can mean the difference between making a strategic leap and missing an opportunity. For businesses using Microsoft Dynamics 365 Customer Engagement, SQL Server Reporting Services (SSRS) offers a robust way to turn raw data into clear, actionable reports. With SSRS, you can go beyond the surface, diving into trends, tracking KPIs, and understanding customer behavior – all in one centralized platform.
With the ability to customize reports that pull data directly from Dynamics 365 Customer Engagement, your team can gain targeted insights right where they need them – no extra tools, no wasted time. This guide walks you through building SSRS reports in Microsoft Visual Studio, followed by seamless deployment into your Dynamics 365 environment. By following these steps, you’ll be set to create visual reports that serve your business needs, turning complex data into clear, actionable insights that drive meaningful decisions.
What is SQL Server Reporting Services?
SQL Server Reporting Services (SSRS) is a comprehensive reporting platform created using SQL Server Data Tools. This reporting platform offers a powerful toolkit for creating, deploying, and managing detailed SSRS paginated reports right from your own servers. With SSRS, you can build reports tailored to your needs, making it easy to organize, visualize, and share insights within your organization, all in a secure, on-premises environment.
SQL Server Reporting Services provides detailed visualizations of business statistics and analytics, enabling organizations to gain valuable insights into their performance. Using advanced SSRS reports, businesses can make more informed and data-driven decisions, leading to improved strategic planning and outcomes.
SSRS serves both database professionals and end users: database professionals handle report server management and subscription setups, while end users consume SSRS reports and can also create reports to suit their needs.
How to create an SSRS report in Microsoft Visual Studio?
Building reports might seem complex, but with SSRS in Visual Studio, it’s simpler than you would think. You can customize and design reports that fit your exact needs. Let’s walk through the steps to get your report up and running using Visual Studio.
Step 1: Download and install Microsoft Visual Studio 2019
Start by downloading and installing Visual Studio 2019. During the installation, ensure that the data storage and processing workload is selected, as it is required to enable report service project functionality.
Step 2: Add extensions for SSRS
After completing the installation, open Visual Studio and navigate to Manage Extensions from the top menu. Install the necessary extensions: Microsoft Reporting Services Projects and SQL Server Integration Services Projects.
Once the extensions are installed, create a new project. Search for Report Server Project, click Next, then provide a name and location for your project. Click Create, and the Visual Studio project will open.
Step 3: Set up a new report
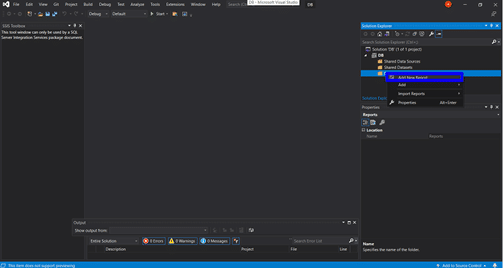
In the Solution Explorer pane on the right, right-click on the Reports folder, then select Add > New Report. Follow the prompts and click Next to proceed with the report creation.
Step 4: Configure data source
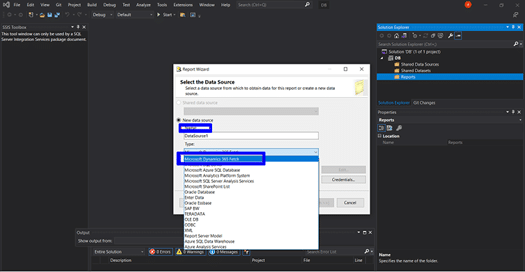
In this step, enter a name for your Data Source. Under the Type section, select Microsoft Dynamics 365 Fetch, as SSRS reports for Dynamics 365 require the use of the FetchXML data format.
Step 5: Set up a connection string
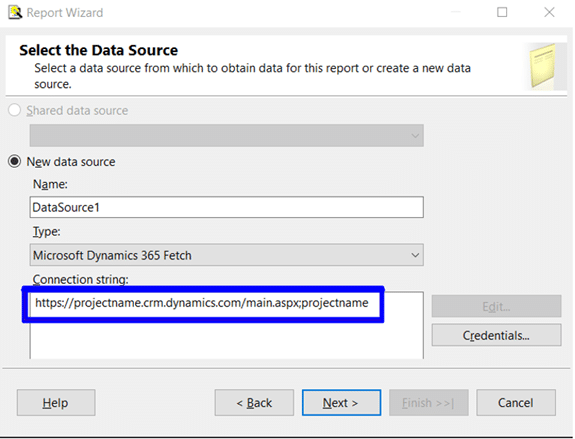
In the next section, you will need to provide the Connection String, which is simply the URL of your Dynamics 365 CRM platform. This connection string links your report to the Dynamics environment.
Step 6: Specify the credentials
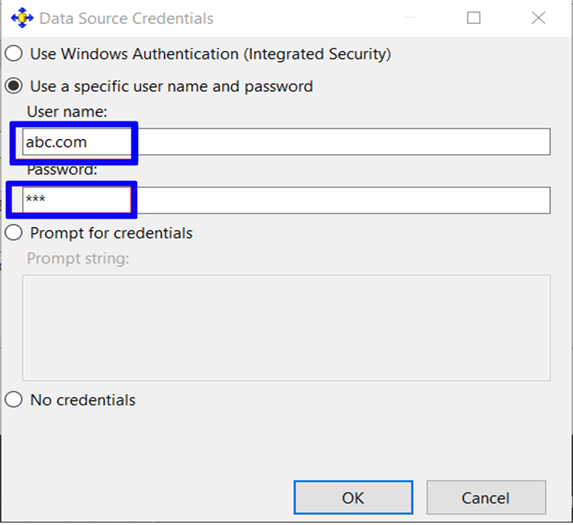
In the Credentials section, select the option to specify credentials. Enable the second option to provide your Username and Password for accessing the Dynamics 365 CRM platform. Once entered, click Next to proceed.
Step 7: Add the FetchXML query
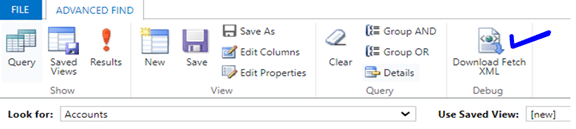
On the following page, you will need to supply the FetchXML query. If you don’t have a FetchXML file, you can generate one by using Advanced Find in Dynamics 365. Build your desired query, then click Download FetchXML to obtain the file. Once downloaded, upload the FetchXML file to proceed with the report creation.
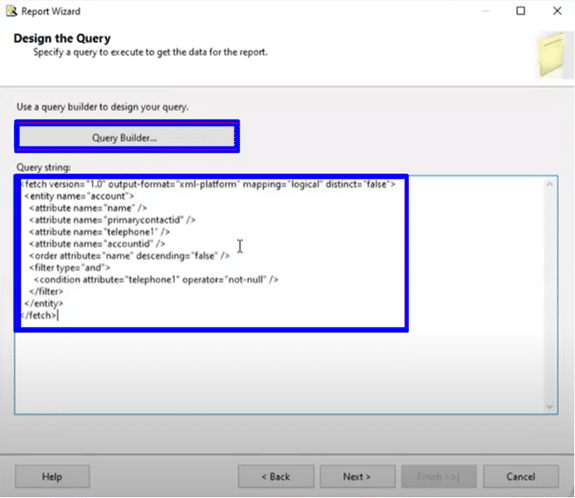
Open the downloaded FetchXML file using Notepad, then copy all the text from the file. Go back to the report setup in Visual Studio and paste the copied text into the Query String section. After pasting the FetchXML, click Next to continue.
Step 8: Choose the report layout
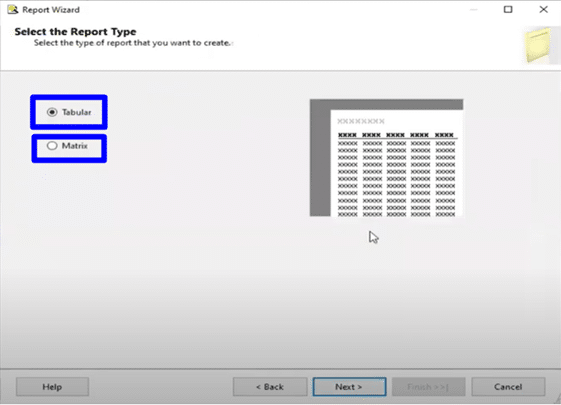
On the next page, choose the report layout format (Tabular or Matrix) based on your reporting needs. Once selected, click Finish. Your SSRS report project will now be created in Visual Studio, and you can begin customizing and designing your report.
How to create and develop an SSRS Report?
Creating SSRC reports involves more than simply displaying data, it requires thoughtful structuring and design to ensure clarity and usability. Drawing from our experience in developing SSRS reports, here are key guidelines on how to effectively build reports using fields, tables, images, and expressions, along with multiple datasets.
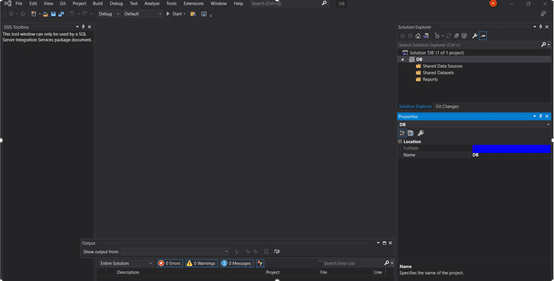
1: Open the SSRS project
Launch your SSRS project in Visual Studio. The Report Data section will be displayed on the left side, which includes several folders such as Images, Data Sources, and Datasets. Use these folders to organize your report components. For instance, place any images you plan to use in the Images folder.
2: Configure data source
The Data Source contains the necessary details about your database server, including the connection string and login credentials. Ensure that this is correctly configured to connect to your data.
Set up datasets
A Dataset defines the specific entity query that retrieves data for your report. Each dataset should be tailored to fetch the relevant data required for your reporting needs.
4: Add fields to the report
In SSRS reports, you can use various elements such as fields, tables, images, and expressions. There are two primary methods for adding fields to your report:
5: Drag and drop from dataset
Open the Dataset and drag the desired field into the report area. To modify properties such as alignment, text size, or label name, right-click on the field and select Placeholder Properties. Adjust the settings according to your requirements.
- Using expressions: Alternatively, you can add fields through expressions. Right-click on a blank area of the report, choose Insert Placeholder, and enter the expression for your field.
- Displaying list-type data: To present list-type data, use a Table in the report. Add your dataset to the Tablix properties. Right-click on the table, open Tablix Properties, and specify the dataset name. Modify the table properties as needed to fit your design.
5: Add images in SSRS reports
SSRS supports different types of image sources:
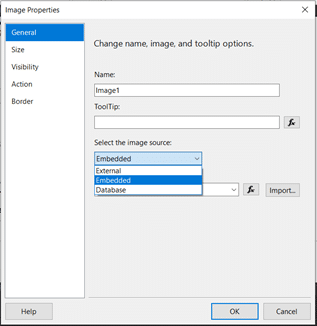
• External: Select a dataset field that contains a URL pointing to the image.
• Embedded: Choose this option when your image is located in your project’s Images folder.
• Database: Select this option when you specify a database field that contains the image data.