Creating a matrix on a form in Microsoft Dynamics 365 Finance & Operations (D365 F&O) allows users to visualize and interact with data in a structured and meaningful way. A matrix-style grid can help in scenarios such as budgeting, financial reporting, and inventory management by displaying data dynamically in a row and column format.
When working in D365 Finance and Operations the grid control is often the go-to solution for displaying data. It’s bound to a data source and provides a structured way to show rows and columns. However, what happens when you need to go beyond static grids and present data dynamically in a matrix format?
Creating a matrix on a form in Microsoft Dynamics 365 Finance & Operations (D365 F&O) allows users to visualize and interact with data in a structured and meaningful way. A matrix-style grid can help in scenarios such as budgeting, financial reporting, and inventory management by displaying data dynamically in a row and column format.
In this blog, we will explore how to create a matrix on a form in Dynamics 365 Finance and Operations and represent data in matrix format.
What are matrix forms in Dynamics 365 Finance and Operations?
In Dynamics 365 Finance & Operations (D365 F&O), a matrix on a form is a structured way of displaying data in a grid format, typically used to present information that involves multiple dimensions, such as products, locations, time periods, or attributes.
Where is it used?
- Retail and commerce: To show product variants like size, color, or style in a matrix format.
- Production and inventory: For capacity planning, demand forecasting, or stock availability.
- Financial reporting: To compare financial data across periods, departments, or cost centers
Matrix representation is a standard feature in SSRS reports, but did you know it’s also possible to achieve this directly on a D365FO form? This is where Table Control comes into play.
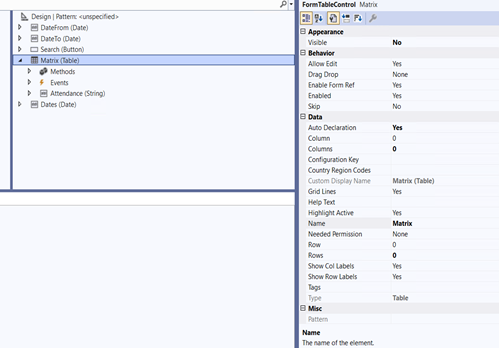
The Table Control is a powerful, unbound control that enables developers to create dynamic and interactive experiences. Unlike standard grid or ListView controls, it allows for:
- Defining the number of rows and columns dynamically.
- Varying the input type for each individual cell.
- Enhanced user interaction with flexible, custom layouts.
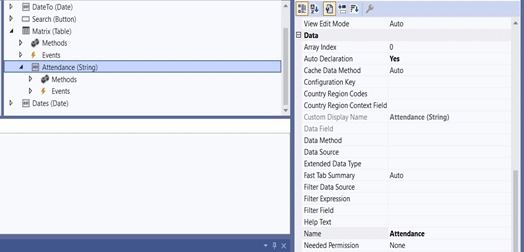
At its core, the Table Control relies on an edit control method, which dynamically determines the type of input control (such as text boxes, checkboxes, or dropdowns) for each cell. This capability makes it incredibly versatile for scenarios requiring dynamic and customizable data representation.
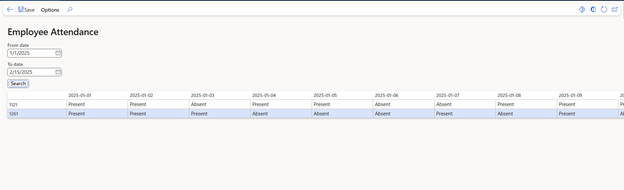
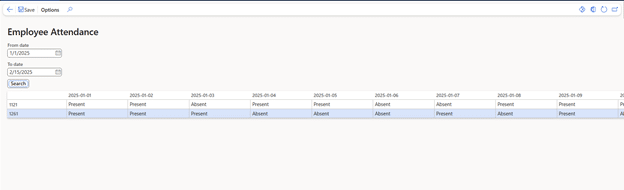
Our end result looks like this:
Prerequisites for creating a matrix on a form
To build a dynamic matrix in Dynamics 365 Finance and Operations ensure you have:
D365FO development skills
Knowledge of form design, controls, and X++ logic.
Development environment
A sandbox or VM with Visual Studio integrated with D365FO.
Understanding of table control
Familiarity with unbound controls and their customization.
Edit control method knowledge
Skills to create methods that define control types (e.g., text box, dropdown) dynamically for matrix cells.
Defined use case
A clear scenario, such as visualizing employee attendance.
Employee attendance data
You have employee attendance data stored, which needs to be transferred into the matrix.
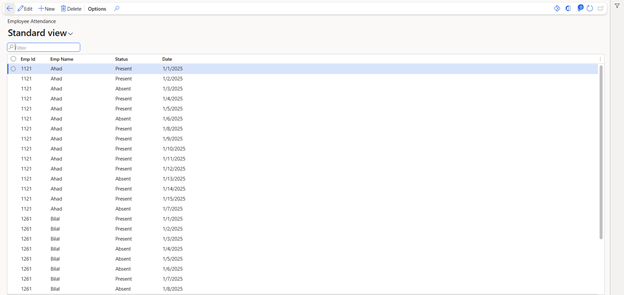
Use case: Dynamic employee attendance Matrix
Let’s explore how to create a dynamic matrix that showcases employee attendance. In this example:
- Each row represents an employee.
- Each column represents a specific date.
- Each cell represents an employee attendance status.
- The number of columns adjusts dynamically based on the selected date range.
- The date range should be limited to 30 days. If the range exceeds 30 days, the matrix will not be generated.